

FOMC :: GDP :: PCE
A quarter-point rate hike, second-quarter real GDP growth of 2.4%, and disinflation in the Fed's preferred inflation gauge.
FEDERAL OPEN MARKET COMMITTEE :: MONETARY POLICY
As expected, the Federal Open Market Committee (FOMC) voted unanimously to increase the federal funds rate 25 basis points to a target level of 5.25% to 5.5% on Wednesday. FOMC members also voted to continue the quantitative tightening program which shrinks the size and scope of the Fed’s balance sheet at a pace of up to $95 billion per month. Below is the post-meeting FOMC statement:

Following the FOMC meeting Chair Powell hosted a press conference which you can watch here or read the PDF transcript here. We learned a few interesting tidbits during the media conference. First, the Fed staff have revised their economic forecasts for 2023 and are no longer forecasting a recession, but instead a slowdown in economic growth. Chair Powell offered no opinion on whether a rate hike was likely at the next FOMC meeting on September 19th and 20th. The Fed is now clearly in a data-dependent mode so if the disinflationary trend that has been in place for some time continues, we think FOMC members will be comfortable “skipping” a rate hike at the September meeting. However, if the inflation rate remains stubbornly too high, they will not hesitate to raise interest rates further later this year. The current pace of inflation remains well above the 2% target level, so we need disinflation to continue in order for the Fed to stop hiking rates. For now, market participants expect the Fed to hold rates steady at the 5.25% to 5.5% target range.

GROSS DOMESTIC PRODUCT (GDP)
Real gross domestic product (GDP) increased at a 2.4% annual rate in the second quarter of 2023, following 2.0% real GDP growth in the first quarter. For the first half of 2023, real GDP growth averaged 2.2%, which is very close to our 2.0% long-term trend growth estimate for the U.S. economy.

Personal consumption expenditures are the most important component within the GDP report, representing nearly 70% of GDP. During the second quarter, PCEs contributed 1.1% to the overall 2.4% figure, down from a 2.8% contribution in the first quarter. Gross private investment contributed 1.0%. Net exports subtracted -0.1% and government consumption expenditures added 0.45%. You can view a more detailed real GDP contribution breakdown in Table 2 of the report.
PERSONAL CONSUMPTION EXPENDITURES (PCE)
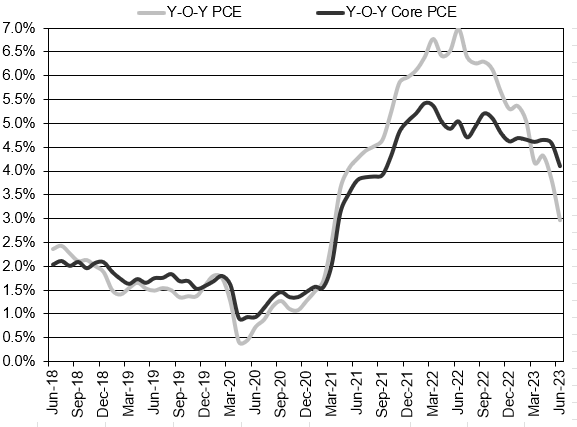
The PCE inflation report showed the PCE price index increased 0.2% during the month of June. Disinflation is a reduction in the rate of inflation, and a disinflationary trend has now been in place for a year. Food prices fell 0.1% and energy prices rose 0.6%. The pace of headline PCE inflation peaked at 7.0% year-over-year in June 2022 and has decelerated to 3.0% in June 2023. The core PCE rate, which excludes food and energy prices, peaked at 5.4% in February 2022 and has decelerated to 4.1% in June 2023. As you can see in the chart below, the core PCE rate (black line) had been moving sideways for the past six months, so it is good to see it finally decline again. The Fed needs to remain vigilant to get the core PCE inflation rate back down to 2%, but the disinflationary trend is firmly in place. The most recent three-month (annualized) core PCE inflation rate fell to 3.4%. Today’s PCE inflation report is supportive of a “skip” at the next FOMC meeting, but there are still several weeks of incoming economic data to be considered.
Headline PCE:
+0.2% seasonally adjusted in June, following +0.1% in May
+3.0% year-over-year
+2.5% latest 3 months annualized
+3.3% latest 6 months annualized
Core PCE: (excludes food and energy)
+0.2% seasonally adjusted in June, following +0.3% in May
+4.1% year-over-year
+3.4% latest 3 months annualized
+4.1% latest 6 months annualized
Long-Term Chart of Headline and Core PCE Inflation (Year over Year Change)

Summary Tables from BEA.gov PCE report:

Core-PCE YoY Percent change from the same month one year ago:

Source: BEA.gov