

Model Portfolios | August Update
S&P 500 6339.39 | 10-Year UST Yield 4.37% | July 31, 2025
“You make most of your money in a bear market, you just don’t realize it at the time.”
-Shelby Davis
FEDERAL RESERVE UPDATE
The Federal Open Market Committee (FOMC) voted to keep the federal funds target range unchanged at 4.25% to 4.5% at the end of July. The Fed will also continue to reduce its holdings of U.S. Treasury securities and mortgage-backed securities (MBS). In the monetary policy statement, Fed officials noted that “swings in net exports continue to affect the data, recent indicators suggest that growth of economic activity moderated in the first half of the year.”
In the post-meeting press conference, Fed Chair Powell’s prepared remarks reinforced his view that the Fed is ready to cut rates once the incoming data shows inflation is returning toward the Fed’s 2% target level, provided the labor market remains healthy.
“Inflation has eased significantly from its highs in mid-2022 but remains somewhat elevated relative to our 2 percent longer-run goal. Estimates based on the Consumer Price Index and other data indicate that total PCE prices rose 2.5 percent over the 12 months ending in June and that, excluding the volatile food and energy categories, core PCE prices rose 2.7 percent. These readings are little changed from the beginning of the year, although the underlying composition of price changes has shifted: services inflation has continued to ease, while increased tariffs are pushing up prices in some categories of goods. Near-term measures of inflation expectations have moved up, on balance, over the course of this year on news about tariffs, as reflected in both market-based and survey-based measures. Beyond the next year or so, however, most measures of longer-term expectations remain consistent with our 2 percent inflation goal.”
-Fed Chair Powell
The CME FedWatch Tool is pricing in an 80% probability of a rate cut at the September 16th and 17th FOMC meeting. If the labor market weakens or the inflation rate decelerates, the Fed is prepared to cut the fed funds rate.
GROSS DOMESTIC PRODUCT
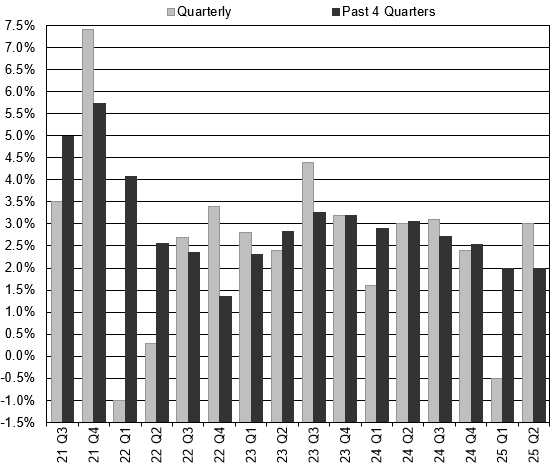
Real gross domestic product (GDP) increased at a 3.0% annualized rate during the second quarter of 2025, following a -0.5% contraction in the first quarter. During the first half of 2025, real GDP growth averaged 1.25% and over the past year, real GDP has matched our long-term trend growth rate estimate of 2.0%.
Personal consumption expenditures (PCEs) are the most significant component within GDP, representing nearly 70% of the overall GDP figure. During the second quarter, PCEs contributed 1.0% to the overall 3.0% figure, an improvement from their 0.3% contribution in the first quarter. Gross private investment subtracted -3.1%. Net exports contributed 5.0% and government consumption expenditures added 0.1%. View a more detailed real GDP contribution breakdown in Table 2 of the report.
Looking ahead to the third quarter, the Atlanta Fed GDPNow model has an initial forecast of 2.3%. The New York Fed Nowcast estimates third-quarter growth at 2.4%.
HOUSING MARKET
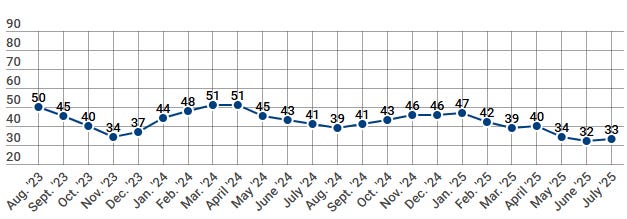
The NAHB/Wells Fargo Housing Market Index (HMI) measures conditions in the single-family housing market. The index rose 1 point from 32 to 33. HMI Index readings above 50 indicate favorable sentiment among single-family home builders. The current sales conditions index rose 1 point to 36, the measure of sales expectations over the next six months increased 3 points to 43, and the prospective buyer traffic index fell 1 point to 20. The July survey showed a record 38% of builders are cutting prices. The NAHB Chief Economist noted “Single-family housing starts will post a decline in 2025 due to ongoing housing affordability challenges”. Regionally, the Northeast remained the strongest, rising 2 points to 45. The Midwest was unchanged at 41. The South fell 3 points to 30, and the West remains the weakest, falling 3 points to 25.
INFLATION UPDATE
The Fed’s preferred inflation measure is the personal consumption expenditure (PCE) price index. The most recent PCE report showed that the index increased by 0.3% in June. The core PCE, which excludes the food and energy components, also rose 0.3% in June. On a year-over-year basis, headline PCE increased 2.6% and core-PCE increased 2.8% in June.
As shown in the chart below, the headline and core PCE rates have been moving mostly sideways for over a year now. The most recent three-month annualized headline PCE inflation rate is 2.5%, and the three-month annualized core-PCE rate is 2.6%. Most FOMC members are prepared to lower the fed funds rate as soon as the three-month annualized inflation rate decelerates toward the Fed’s 2.0% inflation target.
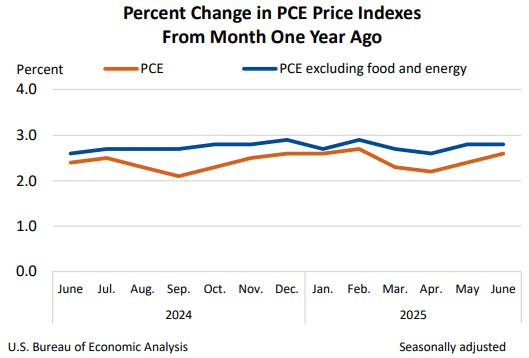
Headline PCE:
+0.3% seasonally adjusted in June, following 0.2% in May
+2.6% year-over-year
+2.5% latest 3 months annualized
+2.9% latest 6 months annualized
Core PCE: (excludes food and energy)
+0.3% seasonally adjusted in June, following 0.2% in May
+2.8% year-over-year
+2.6% latest 3 months annualized
+3.2% latest 6 months annualized
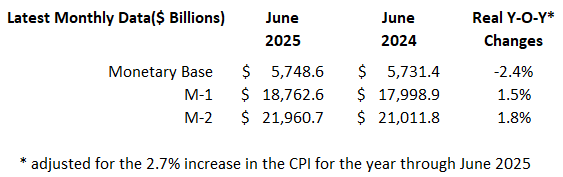
MONEY SUPPLY
Below is the monthly update of the Marketimer and Brinker Fixed Income Advisor Model Portfolios through July 31, 2025
