

“Rational people don’t risk what they have and need for what they don’t have and don’t need.”
COMMENTARY
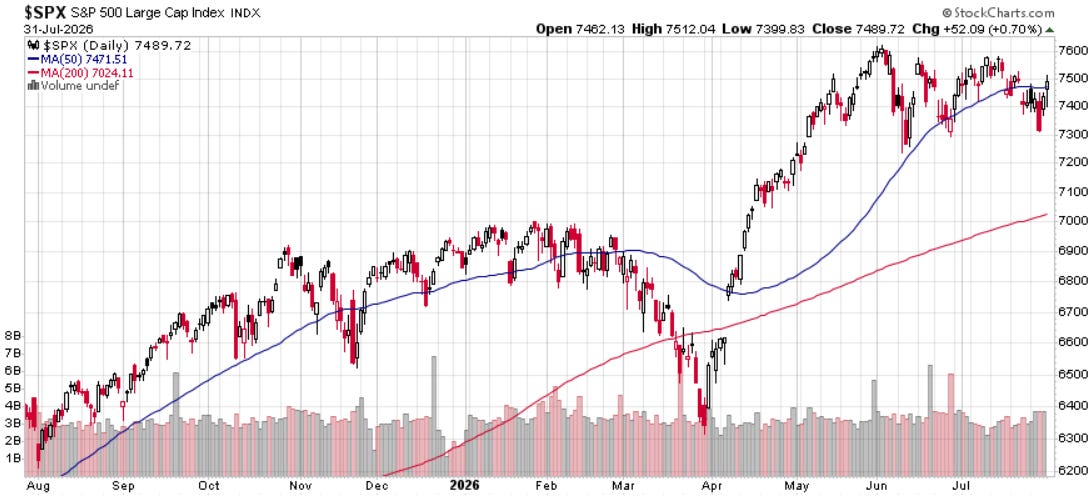
The S&P 500 closed at 7,489.72 on July 31, 2026, 1.6% below its all-time closing high of 7,609.78 reached on June 2. The index traded sideways in July amid concerns about elevated valuations and persistent inflation, closing the month down modestly. The Nasdaq Composite Index closed 6.3% below its all-time closing high of 27,093.90, also reached on June 2.
Speculative leverage continues to increase, with margin debt reaching a record $1.50 trillion in June, up about 6% from May’s record of $1.42 trillion and nearly 50% from one year ago. The rapid increase in margin debt is one reason we continue to recommend patience before making new equity commitments.
The Conference Board’s Leading Economic Index (LEI) declined 0.2% in June to 99.1. Over the first half of 2026, the LEI has been mostly stable, slipping just 0.3% versus the 1.1% decline over the second half of 2025. June’s weakness came from consumer expectations and building permits, partly offset by positive contributions from the yield spread and financial components. The Conference Board slightly increased its 2026 GDP growth forecast from 1.8% to 1.9%.
GDP UPDATE
Real gross domestic product (GDP) grew at a 1.5% annual rate in the second quarter of 2026, down from 2.1% in the first quarter, according to the latest Bureau of Economic Analysis (BEA) report. During the first half of 2026, real GDP grew at an average annualized rate of 1.8%, very close to our 2.0% trend growth rate forecast.


Personal consumption expenditures, which account for nearly 70% of GDP, contributed 2.1 percentage points to second quarter real GDP growth, up from 0.4 percentage point in the first quarter. Gross private domestic investment added 0.5 percentage point. Government consumption expenditures subtracted 0.1 percentage point, while net exports subtracted 1.0 percentage point. A surge in capital goods imports related to AI infrastructure investment reduced overall real GDP growth because imports are subtracted from GDP.
The New York Fed’s GDP Nowcast forecasts 2.5% growth for third-quarter real GDP, with the estimate remaining largely unchanged in recent weeks. The Atlanta Fed’s initial GDPNow estimate is considerably higher at 5.0%, driven by growth across consumer spending and private inventories. We continue to forecast 2026 real GDP growth of roughly 2%.
EMPLOYMENT UPDATE
The June Employment Report showed slower payroll growth and a contraction in the labor force. Total nonfarm payroll employment rose 57,000 in June, and payroll gains averaged 111,000 during the three months ending in June. The unemployment rate declined 0.1 percentage point to 4.2%, while the labor force participation rate fell 0.3 percentage point to 61.5%. Revisions to the prior two jobs reports were negative, with April revised down 31,000 and May down 43,000, leaving job growth 74,000 lower than previously reported.

Average hourly earnings rose 0.3% in June and are up 3.5% year-over-year, matching the headline consumer price inflation (CPI) rate. The Employment Cost Index (ECI) measures changes in wages, salaries, and employer benefit costs. The second quarter report showed that benefit costs are growing faster than wages, with rising health insurance costs contributing to the increase. Weekly initial jobless claims were 197,000 in the week ended July 25 and remain at historically low levels. These labor market figures are consistent with a low-hiring, low-firing labor market.
HOUSING MARKET UPDATE
The NAHB/Wells Fargo Housing Market Index (HMI) measures conditions in the single-family housing market. The index fell two points in July to 34, down from an upwardly revised reading of 36 in June and remaining well below the 50 threshold that signals favorable sentiment among builders. This marked the fifteenth consecutive month that the index remained below 40, the longest such stretch since 2012. The latest HMI survey also showed that 37% of builders cut prices in July, up from 35% in June and 32% in May. The average price reduction was unchanged at 6%. The use of sales incentives increased to 63% from 62%, the sixteenth consecutive month in which this share has reached 60% or higher.
All three major HMI components declined in July. The current sales conditions index fell one point to 37; the measure of sales expectations over the next six months declined two points to 43; and the prospective buyer traffic index fell two points to 23. The NAHB noted that rising material prices, high land costs, elevated mortgage rates, and persistent skilled labor shortages continue to weigh on builder sentiment. Regionally, based on three-month moving averages, the Northeast rose one point to 45, the Midwest increased two points to 45, the South fell one point to 33, and the West declined one point to 26.

The Census Bureau reported that total housing starts increased to 1.427 million in June, 19% above May and 3.5% above the June 2025 pace. The increase was concentrated entirely in the volatile multifamily segment: starts in buildings with two or more units rose to a 532,000 annual rate, including 513,000 in buildings with five units or more. Single-family starts slipped to 895,000, slightly below the revised May figure and down 3.2% year-over-year. Building permits, a leading indicator of future construction activity, were 2.3% lower than a year ago. The permit data suggest single-family construction is likely to remain soft in the months ahead, consistent with the builder sentiment readings above.
New home sales increased modestly in June. Sales of new single-family homes rose 1.6% month-over-month in June to a 628,000 annual rate, though still 5.6% below the year-ago pace. New home inventory remains elevated at 485,000 homes for sale, which represents 9.3 months of supply, above the four to six months of supply generally considered healthy.
INFLATION UPDATE
The headline personal consumption expenditures (PCE) price index increased 3.7% during the twelve months ending in June, compared with 4.1% in May. The core PCE inflation rate, which excludes the volatile food and energy components, eased to 3.3% year-over-year from 3.4%. On a month-over-month basis, headline PCE fell 0.1%, while core PCE increased 0.1%.
The consumer price index (CPI) decelerated in June to 3.5% year-over-year. Core CPI, which excludes the volatile food and energy components, decelerated to 2.6% year-over-year. The 0.4% month-over-month decline in headline CPI was driven primarily by energy, with the energy index falling 5.7% in June. The Dallas Fed’s trimmed-mean PCE increased 2.2% year-over-year in June, down from 2.4% in May. The Cleveland Fed’s trimmed-mean CPI increased 2.6% year-over-year in June.
The June PCE and CPI reports show that inflation is slowing, although both inflation measures remain above 2%. Chair Warsh has said the FOMC is reviewing the inflation measures it uses in making policy decisions. The trimmed-mean CPI and PCE measures also moved lower in June.

Headline PCE:
−0.1% month-over-month seasonally adjusted
+3.7% year-over-year
Core PCE: (excludes food and energy)
+0.1% month-over-month seasonally adjusted
+3.3% year-over-year
Subscriber Note: We recently added an “Economic Dashboard” to our website, which tracks the key economic indicators we regularly monitor. You can access it anytime here: https://econ.brinkeradvisor.com/
FEDERAL RESERVE UPDATE
During his semiannual testimony before Congress, Chair Warsh focused on two primary themes: achieving price stability and reforming the FOMC’s communication, forecasting, and analytical processes. Throughout his testimony, Chair Warsh reinforced that the Committee has “no tolerance for persistently elevated inflation.” In recent speeches, Governor Cook noted that inflation remains 1.7 percentage points above the 2% target, and Vice Chair Jefferson warned that it “could be appropriate to reconsider our current policy stance” if inflation does not cool promptly.
Chair Warsh also discussed his plans to reform the Fed’s policymaking process. He said he had appointed task forces to review Fed communications, the balance sheet and the ample-reserves regime, new data sources and methodology, productivity and jobs, and inflation frameworks.
At the July 28-29 meeting, FOMC members voted 9-3 to maintain the target range for the federal funds rate at 3.50% to 3.75%. Cleveland President Hammack, Minneapolis President Kashkari, and Dallas President Logan dissented in favor of a quarter-point increase, a shift from June’s unanimous 12-0 vote to hold rates steady.
Below is the full monetary policy statement following the July FOMC meeting:
The Committee decided to maintain the target range for the federal funds rate at 3-1/2 to 3-3/4 percent, in support of the Federal Reserve’s dual mandate. The Committee is continuing its policy of maintaining ample reserves in the banking system.
Economic activity is expanding at a solid pace despite elevated uncertainty that owes, in part, to the conflict in the Middle East. Productivity growth and capital investment are strong. Job gains have kept pace with the workforce, and the unemployment rate has changed little.
Inflation remains elevated relative to the Committee’s 2 percent goal, in part reflecting supply shocks that have driven price increases in certain sectors, including energy. The Committee will deliver price stability.
Voting against the monetary policy action were Beth M. Hammack, Neel Kashkari, and Lorie K. Logan, who preferred to raise the target range for the federal funds rate by 1/4 percentage point at this meeting.
Following the July FOMC meeting, Fed Chair Warsh hosted a press conference. You can watch the press conference below or read the transcript PDF here.
At his post-meeting press conference, Chair Warsh noted that nominal and real yields had risen materially during the 42 days since his inaugural FOMC meeting. He said the reduction in forward guidance may have contributed to the increase and noted that the policy statement was steering clear of forecasting.
The next FOMC meeting is scheduled for September 15-16 and will include an updated Summary of Economic Projections (SEP). At the end of July, CME FedWatch probabilities show a 67% chance of a quarter-point rate hike at the September meeting and a 33% chance of no change, with zero probability assigned to a rate cut.
MONEY SUPPLY
MODEL PORTFOLIOS UPDATE
Below is the monthly update of the Marketimer and Brinker Fixed Income Advisor Model Portfolios through July 31, 2026.
