

Model Portfolios | December Update
S&P 500 6849.09 | 10-Year UST Yield 4.02% | November 30, 2025
“We pay the debts of the last generation by issuing bonds payable by the next generation.”
-Lawrence J Peter
COMMENTARY
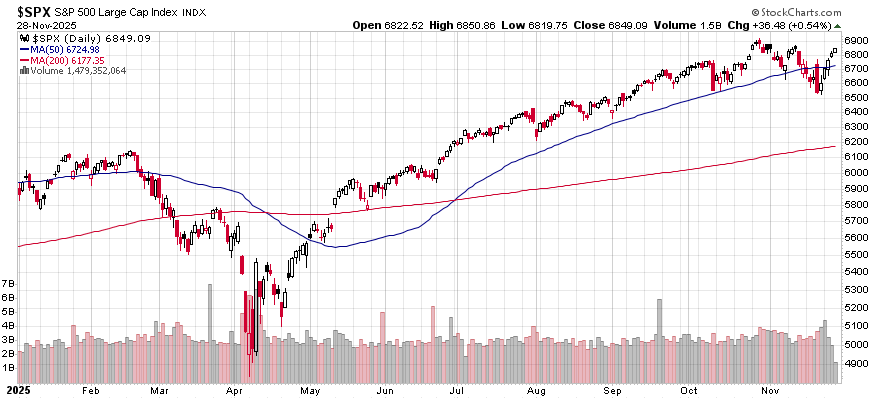
The S&P 500 Index ended November at 6849.09, down slightly from its all-time closing high of 6890.89 on October 28th. As shown in the chart above, since bottoming in April, the S&P 500 rallied strongly into early October. Over the past two months, the index has oscillated between 6500 and 6900. Through November, the index has generated a total return of 17.8%. Even more impressive, the S&P 500 total return has exceeded 17% in six of the last seven calendar years:
S&P 500 Total Return
2025 through 11/30: 17.8%
2024 25.0%
2023 26.3%
2022 -18.1%
2021 28.7%
2020 18.4%
2019 31.5%
Despite the volatility introduced by the recent 43-day government shutdown and the resulting “data blackout,” the stock market has remained remarkably resilient, driven by expectations that the Federal Reserve will continue its rate-cutting cycle in December. The probability of a 25 basis point rate cut at the upcoming December 9-10, 2025 FOMC meeting is almost 90%, according to CME FedWatch. Fed officials are well aware of this market expectation, so their lack of pushback suggests they plan to lower the fed funds rate to a target range of 3.5% to 3.75%.
Assets held in money market funds remain elevated. As of late November, ICI reported $7.567 trillion invested in money funds, including $3.03 trillion in retail funds and $4.53 trillion in institutional funds.

HOUSING MARKET
The NAHB/Wells Fargo Housing Market Index (HMI) measures conditions in the single-family housing market. The index rose 1 point in November to 38, the highest reading since April, though it remains below the 50 threshold that signals favorable sentiment among builders. The current sales conditions index increased by 2 points to 41; the measure of sales expectations over the next 6 months fell by 3 points to 51; and the prospective buyer traffic index increased by 1 point to 26. According to NAHB economists, “We continue to see demand-side weakness as a softening labor market and stretched consumer finances are contributing to a difficult sales environment.” In November, 41% of builders reported cutting home prices, a record high in the post-COVID period. Regionally, the Northeast rose two points to 48, the Midwest dropped one point to 41, the South increased three points to 34, and the West gained two points to 30.
INFLATION UPDATE
The Bureau of Economic Analysis (BEA) has not published the personal consumption expenditure (PCE) inflation data since the government shutdown. They expect to resume publishing the inflation reports in December. The Bureau of Labor Statistics (BLS) reported the September producer price index last week, showing prices rose 2.7% year-over-year through September 2025. The lack of incoming inflation data adds to the difficulty that FOMC members face as they approach the December monetary policy decision. We expect a rate cut at the December FOMC meeting.
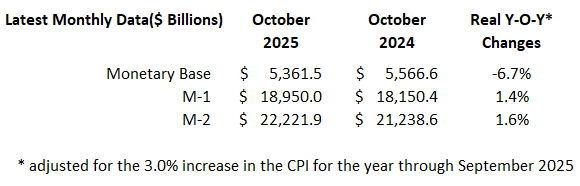
MONEY SUPPLY
MODEL PORTFOLIOS UPDATE
Below is the monthly update of the Marketimer and Brinker Fixed Income Advisor Model Portfolios through November 30, 2025.
