

Model Portfolios | February Update
S&P 500 6939.03 | 10-Year UST Yield 4.24% | January 31, 2026
"Spend each day trying to be a little wiser than you were when you woke up."
COMMENTARY

Real gross domestic product (GDP) grew at a 4.4% annual rate in the third quarter of 2025, following a 3.8% pace of growth in the second quarter, according to the latest Bureau of Economic Analysis report. The first nine months of 2025 saw average real GDP growth of 2.6%. The fourth quarter GDPNow estimate from the Atlanta Fed is currently 4.2%. The New York Fed fourth quarter GDP Nowcast is 2.7%.
Personal consumption expenditures (consumer spending) are the most important component within the GDP report, representing nearly 70% of GDP. During the third quarter, PCEs contributed 2.3% to the overall 4.4% GDP figure, as consumer spending had another solid quarter. Gross private investment was flat at 0.0%. Net exports added 1.6%, and government consumption expenditures added 0.4%. View a more detailed GDP contribution breakdown in Table 2 of the report.
The Bureau of Economic Analysis (BEA) expects to publish the fourth quarter 2025 GDP report and the December PCE inflation report on February 20th:

This month, we will briefly review the five primary causes of a bear market:
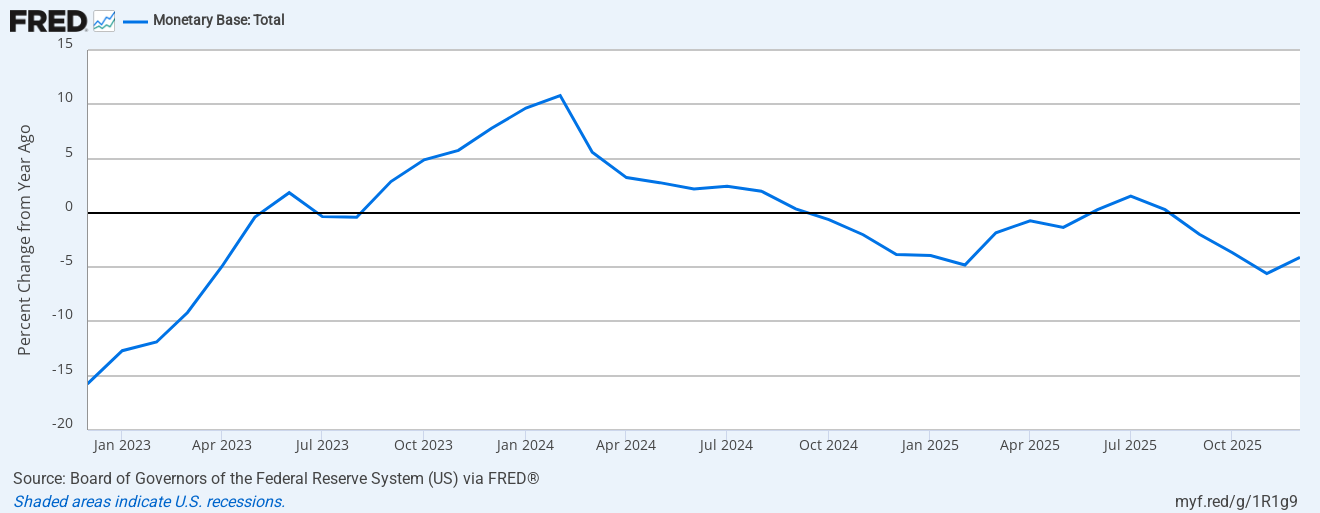
Tight Money: The FOMC has been working to lower its restrictive monetary policy stance and has cut the federal funds rate three times since August. The current fed funds target range of 3.5% to 3.75% is close to a neutral policy stance. The FOMC recently ended the quantitative tightening (QT) program, which had been shrinking the Fed’s balance sheet. The Fed is also working to limit the growth in the monetary base. The following chart shows that the year-over-year percent change in the total monetary base has been below zero for most of the past year.
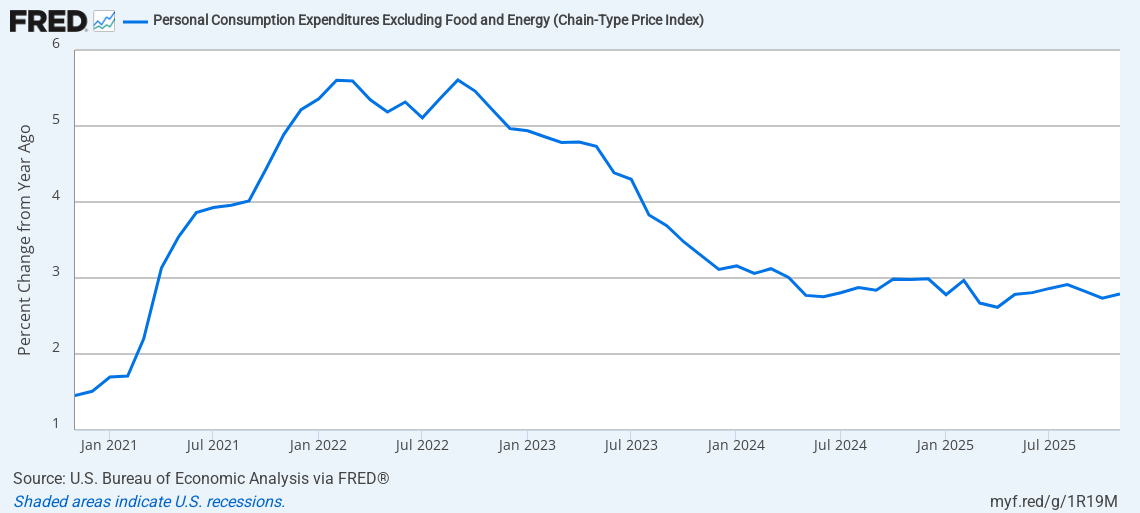
High Inflation: The overall pace of inflation has been moving sideways in recent months, above the Fed’s 2% inflation target. Although the core PCE inflation rate has decelerated from the very high levels a few years ago, the current 2.8% rate remains elevated. This makes it challenging for the FOMC to keep lowering the fed funds rate, despite the weakness in the labor market.
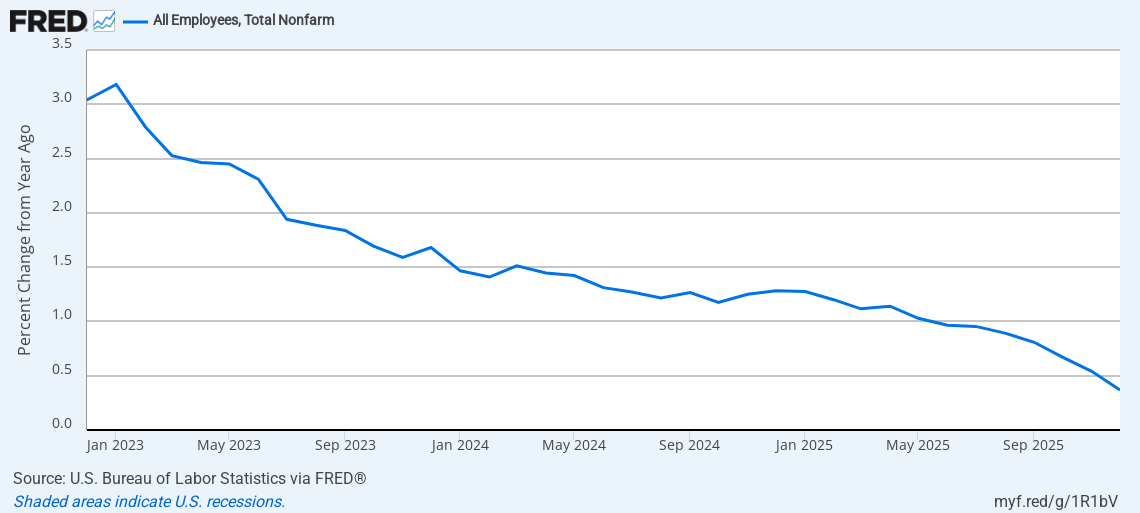
Rapid Growth: The latest gross domestic product (GDP) forecasts indicate the economy is growing at a solid pace. Technology firms continue to invest substantial amounts into artificial intelligence infrastructure. Despite strong GDP growth, slowing demographic trends and businesses’ reluctance to hire have led to a deceleration in overall hiring. The year-over-year change in nonfarm payrolls is poised to turn negative soon, unless hiring accelerates.
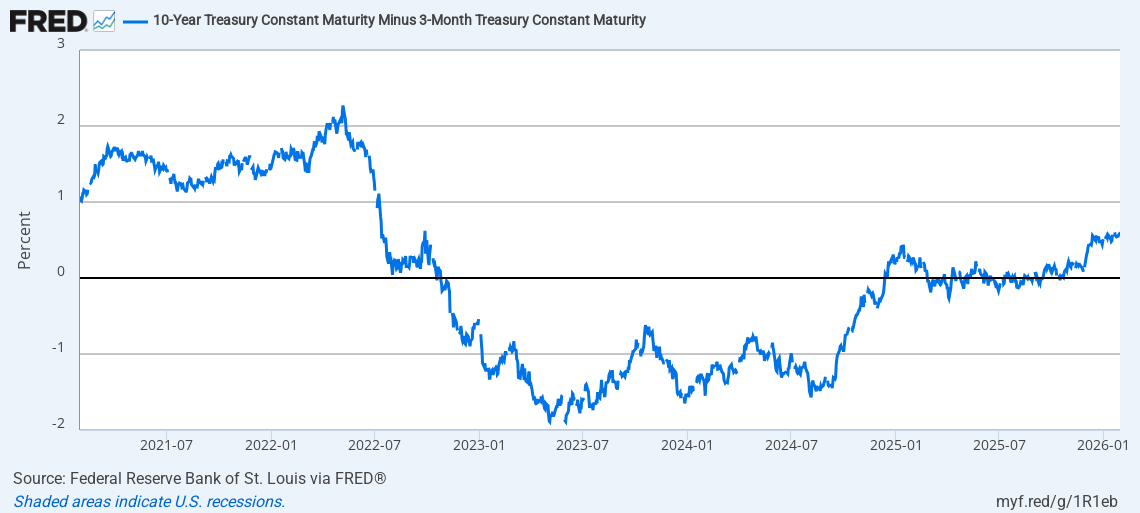
Rising Rates: The FOMC is now in a data-dependent position with the fed funds rate near neutral. Thus far, the Fed has avoided triggering a recession due to excessively tight monetary policy. The prospect of rising rates appears to be a low risk. The U.S. Treasury yield curve inversion that lasted more than 2 years recently ended, with the 10-year note yield 55 basis points above the 3-month bill yield.
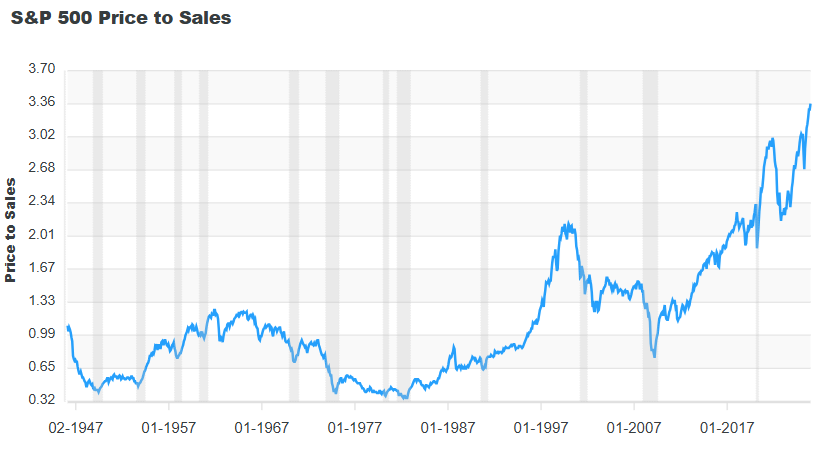
Overvaluation: In early 2000, extreme market euphoria pushed S&P 500 valuations to nearly twice their historical average. This peak, characterized by a price/earnings ratio of 30, triggered a three-year bear market that did not find a definitive floor until March 2003. Although we are not quite at those levels of overvaluation today, several other valuation indicators are flashing warning signals. FINRA reports that margin debt exceeded $1.2 trillion in December, up from $900 billion a year ago. Another example is the S&P 500 price-to-sales ratio, which exceeded its 2000 peak and continues to rise significantly.
MarketWatch columnist Mark Hulbert recently shared the following table of ten stock market valuation indicators, most of which are at (or near) peak levels.

All of these factors are considered in our equity allocations shown in the Marketimer and Brinker Fixed Income Advisor model portfolios below.
INFLATION UPDATE
The Fed’s preferred inflation measure is the personal consumption expenditures (PCE) price index. We recently received the combined October and November 2025 inflation figures, which were delayed by the government shutdown. The data showed that the headline PCE inflation rate was 2.8% year-over-year in November. The core PCE inflation rate, which excludes volatile food and energy components, was also 2.8% year-over-year. These figures remain above the Fed’s 2% inflation target level.

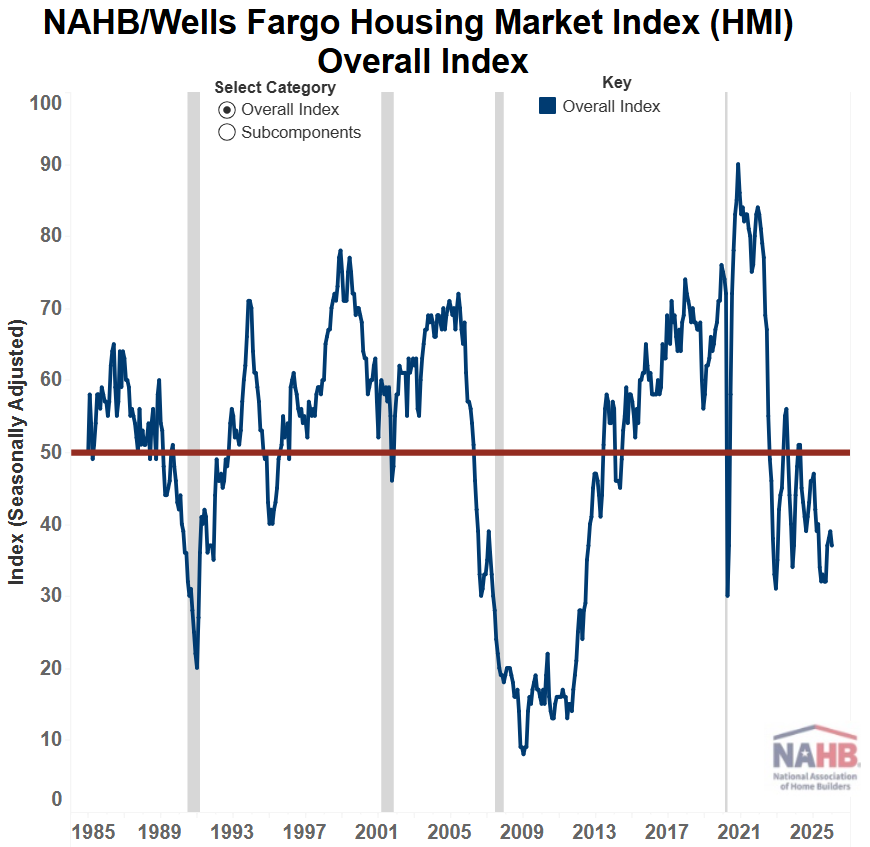
HOUSING MARKET UPDATE
The NAHB/Wells Fargo Housing Market Index (HMI) measures conditions in the single-family housing market. The index fell two points in January to 37, remaining well below the 50 threshold that signals favorable sentiment among builders. The current sales conditions index decreased by 1 point to 41; the measure of sales expectations over the next 6 months fell by 3 points to 49; and the prospective buyer traffic index dropped by 3 points to 23. The new single-family home market continues to show signs of cooling, with 40% of builders reporting price cuts in January, the third consecutive month at or above this level. The average price reduction increased to 6%, up from 5% in December. The use of sales incentives remains high at 65%, marking 10 consecutive months in which this share has exceeded 60%.
FEDERAL RESERVE UPDATE
The Federal Open Market Committee (FOMC) voted 10-2 to keep the federal funds rate unchanged at the January meeting. In the post-meeting statement, FOMC members noted “that economic activity has been expanding at a solid pace. Job gains have remained low, and the unemployment rate has shown some signs of stabilization. Inflation remains somewhat elevated.”
The two dissenting votes were cast by Fed Governors Miran and Waller, both of whom preferred a 25 basis point rate cut at the meeting. A few days later, Fed Governor Waller explained his dissenting monetary policy vote by noting that “Payroll gains in 2025 were very weak. Compared to the prior ten-year average of about 1.9 million jobs created per year, payrolls increased just under 600,000 for 2025. And, last year’s data will be revised downward soon to likely show that there was virtually no growth in payroll employment in 2025. Zero. Zip. Nada.”
The next FOMC meeting is scheduled for March 17th and 18th. The March meeting will include an updated Summary of Economic Projections (SEP). The latest CME FedWatch probabilities indicate a rate cut is unlikely at the March FOMC meeting.
Fed Chair Powell said most FOMC members are satisfied with the current stance of monetary policy, and any future rate decision will depend on incoming economic data. Chair Powell also refused to engage in any dialogue about the next Fed Chair nominee or his plans to remain at the Fed after his term as Fed Chair ends.
You can watch his Jan 28th post-meeting press conference below or read a transcript.
Fed Chair Powell’s term as Chair ends in May, and President Trump has nominated former Fed Governor Kevin Warsh as his replacement. Warsh will need to go through the Senate confirmation process. Chair Powell has the option to remain on the Fed’s Board of Governors until January 2028, although we do not expect him to do that. Normally, an outgoing Fed Chair resigns from the board upon leaving the Chair. Powell has served as a member of the Fed Board of Governors since 2012.
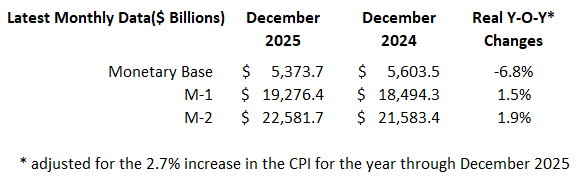
MONEY SUPPLY
MODEL PORTFOLIOS UPDATE
Below is the monthly update of the Marketimer and Brinker Fixed Income Advisor Model Portfolios through January 31, 2026.
