

Model Portfolios | July Update
S&P 500 7499.36 | 10-Year UST Yield 4.46% | June 30th, 2026
“I guess I should warn you, if I turn out to be particularly clear, you’ve probably misunderstood what I’ve said.”
COMMENTARY
First-quarter 2026 real GDP growth was revised up to 2.1% in the latest estimate. The upward revision was driven mainly by lower imports, partly offset by weaker consumer spending. Real final sales to private domestic purchasers were revised down to 1.7%. The New York Fed’s GDP Nowcast estimates second-quarter real GDP growth at +2.7%, while the Atlanta Fed’s GDPNow forecasts 2.5% growth in the second quarter. This month, we will review our real-time economic indicators.
The Association of American Railroads (AAR) reported that total combined rail traffic increased 3.1% through the first 24 weeks of 2026 compared to the same period last year. The combined rail traffic figure includes cumulative carload volume up 3.2% and intermodal units up 3.0%. In the most recent reporting week, seven of the ten carload commodity groups posted increases compared to the same week last year, while the remaining three posted declines.

The American Trucking Associations’ Truck Tonnage Index declined 2.0% in May, following a 0.9% decrease in April. On a year-over-year basis, the index rose 0.6%, slightly below the 2.5% increase in April. Despite the monthly decline, this is the sixth consecutive month in which the index has increased year-over-year, reinforcing the recovery in the goods sector through 2026. Truck tonnage is an important barometer of economic activity, with trucking accounting for more than 70% of the tonnage carried by all modes of domestic freight transportation.

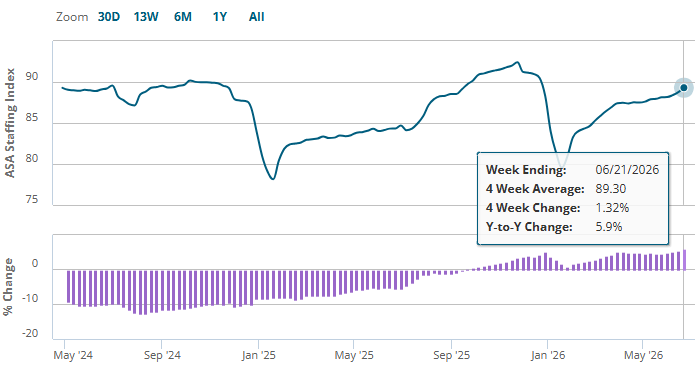
The American Staffing Association (ASA) Staffing Index suggests staffing trends are holding steady, with modest growth since the four-week moving average bottomed near 80 in January 2026. The index’s four-week moving average held at a rounded value of 89, and staffing jobs increased 5.9% year-to-year, averaged over the four weeks ending June 21. The June monthly report, which covered the June 8-14 reference week, showed staffing jobs 5.6% higher than the same week in 2025. ASA’s chief economist noted that “staffing employment continues to see year-to-year gains, even as economic headwinds challenge overall labor demand.” We follow temporary staffing levels because short-term staffing changes typically precede changes in full-time staffing.
The Bureau of Labor Statistics Job Openings and Labor Turnover Survey (JOLTS) showed that job openings were unchanged at 7.6 million in May, following a large increase in April. The job openings rate remained at 4.6%, while hires were unchanged at 5.2 million and the hiring rate held at 3.3%. Total separations changed little at 5.1 million. The quits rate, which measures the number of workers voluntarily leaving their jobs, was unchanged at 1.9%. When the job market is improving, the quits rate generally increases as workers are confident in their ability to find a better job elsewhere. The latest JOLTS figures suggest that employer demand for labor held at April’s improved level, although hiring and worker turnover remain subdued relative to the post-pandemic labor market boom.

Taken together, the real-time economic indicators we follow remain consistent with continued economic growth in the second quarter. Rail traffic and truck tonnage suggest that goods-sector activity continues to expand year over year, while the staffing and JOLTS data indicate that labor demand has improved since earlier this year but remains less robust than during the post-pandemic labor market boom. We continue to expect real GDP growth of approximately 2% this year. However, persistent inflation and a less accommodative Federal Reserve remain risks to the economic outlook.
FEDERAL RESERVE UPDATE
The Federal Open Market Committee (FOMC) voted 12-0 at its June 16-17 meeting to maintain the target range for the federal funds rate at 3.50% to 3.75%. The post-meeting statement noted that the economy “is expanding at a solid pace despite elevated uncertainty that owes, in part, to the conflict in the Middle East. Productivity growth and capital investment are strong. Job gains have kept pace with the workforce, and the unemployment rate has changed little.”
This was Kevin Warsh’s first FOMC meeting as Fed Chair. The unanimous 12-0 vote and shorter post-meeting statement suggest that Chair Warsh was able to unify the Committee around the policy decision while moving toward a more concise communications style. Chair Warsh made clear that he wants to provide less forward guidance around future monetary policy decisions.
The June meeting included an updated Summary of Economic Projections (SEP). The ‘Central Tendency’ excludes the three highest and three lowest estimates among FOMC members. As shown in the table below, the 2026 forecasts for real GDP were lowered, while the forecasts for headline and core PCE inflation were raised. Given these changes, the fed funds rate projection for December 2026 was revised upward by about 50 basis points relative to the prior (March) forecast.

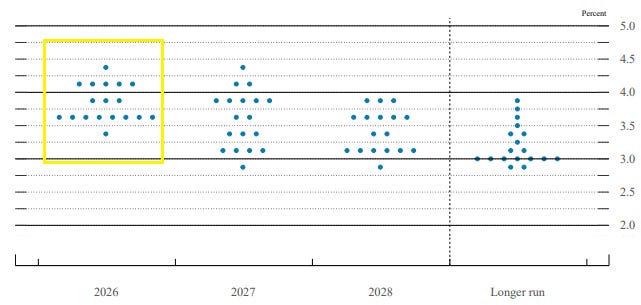
Looking deeper at each SEP participant’s estimate for the federal funds rate at year-end 2026, only one of the eighteen estimates is lower than the current fed funds rate, and eight dots are at the current level. The remaining nine estimates imply one or more rate hikes, with most clustered around one or two quarter-point increases. This suggests that half of FOMC members view the current fed funds rate as appropriate at year-end, while the other half expect one or more rate hikes later this year. Notably, Fed Chair Warsh did not submit a forecast for the fed funds rate. In his press conference, Warsh said he had refrained from offering projections of his own.
Following the June FOMC meeting, Fed Chair Warsh hosted a press conference. You can watch the press conference below or read the transcript PDF here.
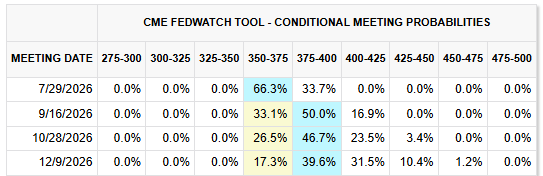
The next FOMC meeting is scheduled for July 28-29. Current CME FedWatch probabilities indicate that a rate increase is unlikely at the July meeting, though those odds are expected to shift as additional inflation data is published. As of this writing, we expect Fed Chair Warsh to keep the fed funds rate unchanged at the July meeting.
INFLATION UPDATE
The Fed’s preferred inflation measure is the personal consumption expenditures (PCE) price index. In May, the headline PCE inflation rate rose 4.1% year-over-year, while the core PCE inflation rate, which excludes the volatile food and energy components, rose 3.4% year-over-year. On a monthly basis, headline PCE increased 0.4%, while core PCE increased 0.3%. These inflation figures remain well above the Fed’s 2% inflation target. The core PCE inflation rate in May was the highest year-over-year rate since October 2023, when the fed funds target range was 5.25% to 5.5%, a much more restrictive monetary policy stance than we have today.
Per the Fed’s June SEP, inflation is expected to remain stubbornly above the Fed’s 2% inflation target throughout the remainder of 2026 and well into 2027. FOMC members forecast the core PCE inflation rate to be 3.2% to 3.5% this year, up significantly from their prior (March) forecast of 2.5% to 2.8%. At his initial FOMC meeting, Chair Warsh emphasized the Fed’s commitment to restoring price stability and achieving its 2% inflation target. It is unlikely that inflation will move toward the 2% target in the near term. We will watch the July FOMC meeting closely for any signal that a majority of FOMC members are prepared to raise interest rates. Notably, half of the FOMC members now forecast a fed funds rate hike by the end of 2026, with one-third anticipating at least two rate hikes this year.

Headline PCE:
+0.4% month-over-month seasonally adjusted
+4.1% year-over-year
Core PCE: (excludes food and energy)
+0.3% month-over-month seasonally adjusted
+3.4% year-over-year
HOUSING MARKET UPDATE
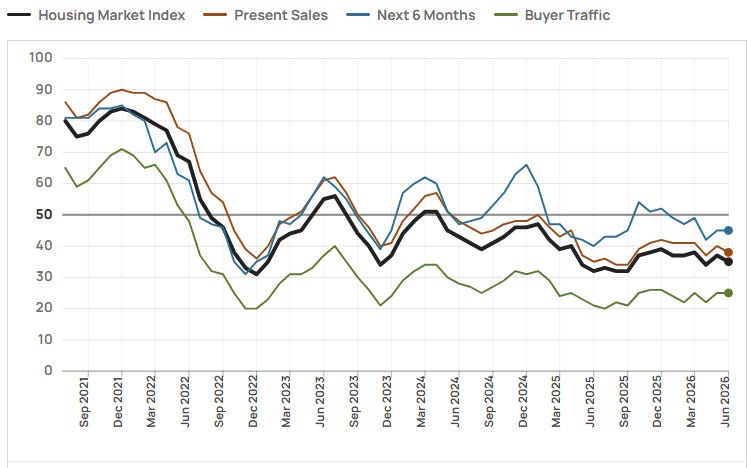
The NAHB/Wells Fargo Housing Market Index (HMI) measures conditions in the single-family housing market. The index fell two points in June to 35, remaining well below the 50 threshold that signals favorable sentiment among builders. This marked the fourteenth consecutive month that the index remained below 40. The latest figure remains consistent with a soft single-family housing market.
The latest HMI survey also showed that 35% of builders cut prices in June, up from 32% in May. The average price reduction was unchanged at 6%. The use of sales incentives increased to 62% from 61%, the 15th consecutive month in which this share has reached 60% or higher.
The current sales conditions index fell two points to 38; the measure of sales expectations over the next six months remained at 45; and the prospective buyer traffic index remained steady at 25. The NAHB noted that rising material costs, elevated mortgage rates, and persistent affordability challenges continue to weigh on builder sentiment and housing demand.
Regionally, based on three-month moving averages, the Northeast rose two points to 44, the Midwest held steady at 43, the South fell two points to 33, and the West declined one point to 27.
The elevated supply of new homes available for sale mirrors this weak demand in the marketplace. At the peak of the housing crisis, the months’ supply reached 12.2 months in January 2009. In May 2026, the months’ supply increased to 10.3 months from 9.3 months in April and remained well above the normal range of roughly four to six months. The number of new homes available for sale also rose to 496,000 from 485,000 in April.
Subscriber Note: We added an “Economic Dashboard” to our website, which tracks the key economic indicators we regularly monitor. You can access it anytime here: https://econ.brinkeradvisor.com/
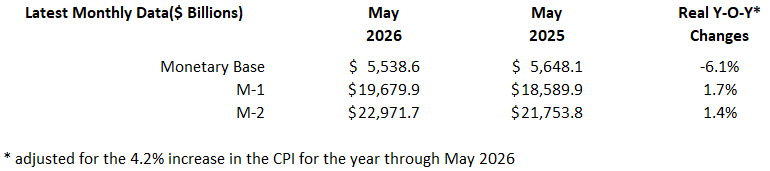
MONEY SUPPLY
MODEL PORTFOLIOS UPDATE
Below is the monthly update of the Marketimer and Brinker Fixed Income Advisor Model Portfolios through June 30, 2026.
