

Model Portfolios | July Update
S&P 500 6204.95 | 10-Year UST Yield 4.23% | June 30, 2025
“Sometimes the best thing to do is to do nothing. The hardest thing to do is to sit with cash. It is very boring.”
COMMENTARY

The S&P 500 achieved a new all-time record high on June 30th when it closed at 6204.95, one percent above the record high of 6144.15 set on February 19th. The rally from the April low has been impressive, taking the S&P all the way back to the low 6000s level from the start of the year. The challenge now, as it was six months ago, is that stock valuations are elevated, with the P/E multiple exceeding 23.4 times calendar-year 2025 earnings.
Real GDP is forecast to rebound in the second quarter following the -0.5% contraction seen in the first quarter. A significant increase in imports, which subtract from GDP, caused the decline in GDP in the first quarter. The Atlanta Fed GDPNow model forecasts real GDP growth of 2.9% in Q2, which would bring the year-to-date average quarterly GDP estimate up to 1.3% for the first six months of 2025. The New York Fed GDP Nowcast model forecasts 1.7% growth in the second quarter.
This month, we will review our favorite real-time economic indicators:
The Association of American Railroads (AAR) reported that total combined rail traffic increased 4.1% through the first 25 weeks of 2025 compared to last year. The combined rail traffic figure includes cumulative carload volume up 2.5% and intermodal units up 5.4%. In the most recent reporting week ending June 21st, seven of the ten carload commodity groups posted increases compared to the same week last year.

The American Trucking Associations’ Truck Tonnage Index fell 0.1% in May, following a 0.5% increase in April. On a year-over-year basis, the index declined 1.3%, marking the first year-over-year decline this year. Trucking is an excellent barometer of economic activity, representing more than 70% of U.S. goods transported. A recovery in the goods sector appears to be underway.

The American Staffing Association (ASA) Staffing Index shows that staffing trends are holding steady through June. The four-week moving average is 5.6% lower year-over-year. We follow temporary staffing levels because short-term staffing changes typically occur before changes in full-time staffing. Temporary staffing has shown more weakness than unemployment insurance claims, nonfarm payrolls, and unemployment for more than 18 months.

HOUSING MARKET UPDATE
The NAHB/Wells Fargo Housing Market Index (HMI) measures conditions in the single-family housing market. The index fell 2 points in June from 34 to 32, to depressed levels rarely seen. HMI Index readings above 50 indicate favorable sentiment among single-family home builders. The current sales conditions index fell 2 points to 35, the measure of sales expectations over the next six months dropped 2 points to 40, and the prospective buyer traffic index declined 2 points to 21. The NAHB Chief Economist noted “Rising inventory levels and prospective home buyers who are on hold waiting for affordability conditions to improve are resulting in weakening price growth in most markets and generating price declines for resales in a growing number of markets”. Regionally, the Northeast remained the strongest, falling 1 point to 43. The Midwest rose 1 point to 41. The South fell 3 points to 33, and the West remains the weakest, falling 4 points to 28. The homebuilder index has only been lower twice since 2012.

INFLATION UPDATE
The Fed’s preferred inflation measure is the personal consumption expenditures (PCE) price index. In May, the headline PCE inflation rate was 2.3% year-over-year. The core PCE inflation rate, which excludes the volatile food and energy components, was 2.7% year-over-year. The 3-month annualized core PCE inflation rate decelerated to 1.7% annualized and the 6-month annualized core PCE inflation rate rose to 2.9%. FOMC members will be watching the 3-month and 6-month core PCE figures very closely over the coming months to see if inflation is moving sustainably toward their 2% inflation target. If the June and July inflation readings are data-friendly, one or two additional fed funds rate cuts are expected.

Headline PCE:
+0.1% seasonally adjusted in May, following 0.1% in April
+2.3% year-over-year
+1.1% latest 3 months annualized
+2.8% latest 6 months annualized
Core PCE: (excludes food and energy)
+0.2% seasonally adjusted in May, following 0.1% in April
+2.7% year-over-year
+1.7% latest 3 months annualized
+2.9% latest 6 months annualized
FEDERAL RESERVE UPDATE
The next FOMC Meeting is scheduled for July 29th and 30th. At the June meeting, FOMC members unanimously voted to keep the fed funds rate unchanged at the 4.25% to 4.5% target range. The Fed policy statement noted that “swings in net exports have affected the data, recent indicators suggest that economic activity has continued to expand at a solid pace. The unemployment rate remains low, and labor market conditions remain solid. Inflation remains somewhat elevated.”
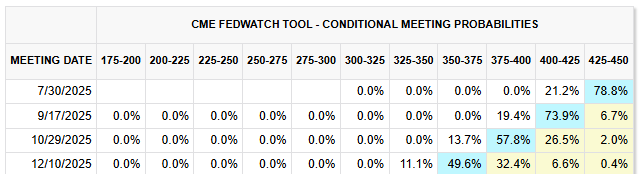
In the June 2025 Summary of Economic Projections, FOMC members maintained their December 2025 fed funds forecast range between 3.9% and 4.4%. This indicates anywhere from zero to two rate cuts over the next six months. As you can see in the table below, real GDP forecasts for 2025 were lowered, unemployment rate forecasts increased, and inflation forecasts rose. Looking at the dot-plot of individual FOMC members’ rate forecasts, the committee is evenly divided with seven members forecasting no rate cuts and eight members forecasting two rate cuts.

Following the June FOMC meeting, the CME FedWatch Tool is currently showing the next fed funds rate cut occurring at the September 17th meeting.
Congress is working to pass a fiscal spending bill that includes lifting the debt ceiling by $5 trillion. The existing debt ceiling is $36.1 trillion, and Treasury Secretary Bessent has said the limit needs to be raised as soon as August. According to the latest CBO figures, the federal budget deficit reached $1.4 trillion through the initial eight months of fiscal year 2025, or $160 billion more than the same period last year. Tax receipts were up $196 billion and expenditures were up $357 billion year-over-year.
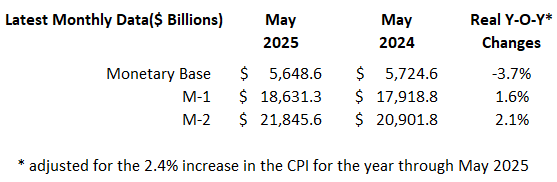
MONEY SUPPLY
MODEL PORTFOLIOS UPDATE
Below is the monthly update of the Marketimer and Brinker Fixed Income Advisor Model Portfolios through June 30, 2025.
