Model Portfolios | June Update
S&P 500 5277.51 | 10-Year UST Yield 4.50% | June 1, 2024
"Successful investing is anticipating the anticipations of others."
COMMENTARY
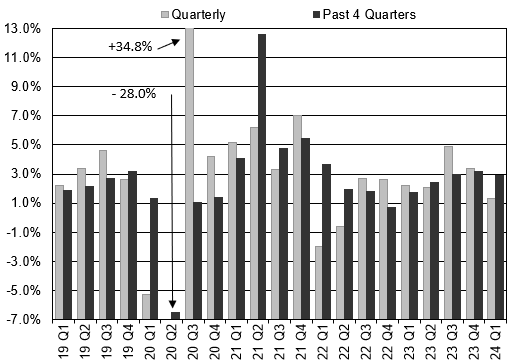
Real gross domestic product (GDP) increased at a 1.3% annualized rate during the first quarter of 2024. Personal consumption expenditures are the most significant GDP component, representing almost 70% of overall GDP. This component increased at a 2.0% annual rate in the first quarter, down from 3.3% in the prior quarter.
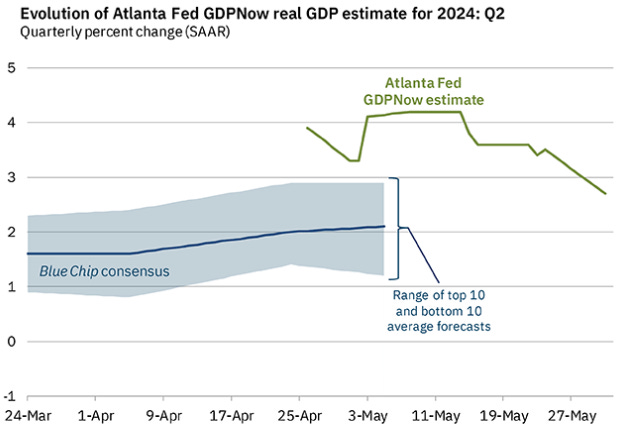
The latest Atlanta Fed GDPNow estimate is for second-quarter GDP growth of 2.7%, and the New York Fed Staff Nowcast forecasts 1.8% GDP growth. We expect the pace of real GDP growth in calendar year 2024 to be near our long-term 2.0% trend growth rate. Large-scale investments in artificial intelligence may lead to a productivity boost and stronger GDP figures. U.S. population growth remains near historic lows, increasing just 0.5% in 2023.
This month we will review our real-time economic indicators.
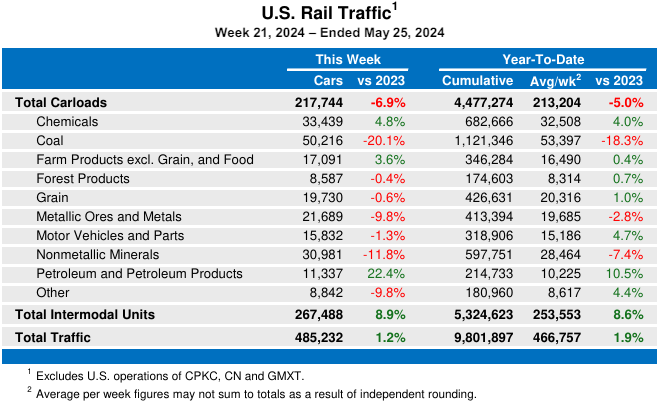
The Association of American Railroads (AAR) reported US railroads saw total combined rail traffic increase 1.9% through the first 21 weeks of 2024 compared to last year. The combined rail traffic figure includes cumulative carload volume down 5.0% and intermodal units up 8.6%. The drop in carload volume is attributed to the large decline in coal volume, which is down 18.3% compared to last year. In the most recent week of reporting, just three of ten carload commodity groups posted an increase compared to the same week last year. Excluding coal, rail traffic looks healthy.
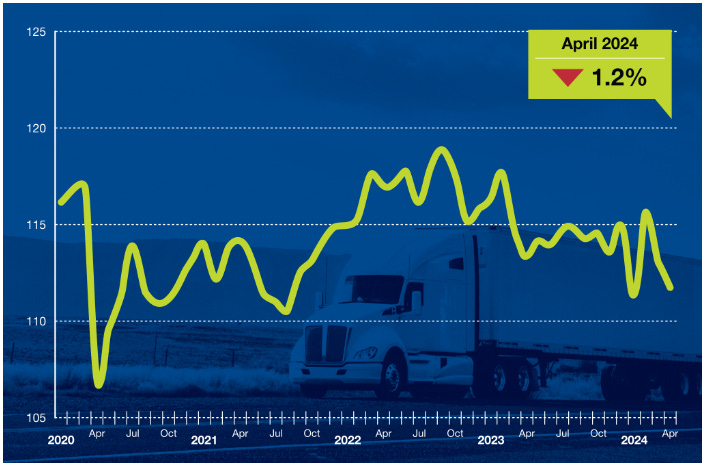
The American Trucking Associations’ Truck Tonnage Index fell 1.2% in April following a 2.2% decline in March. A rebound in freight remains elusive and ongoing softness is expected. On a year-over-year basis, the index fell 1.5% in April, which was the fourteenth consecutive year-over-year decline. Trucking is an excellent barometer of economic activity, representing more than 70% of U.S. goods transported. The recovery in the goods sector of the economy remains elusive.
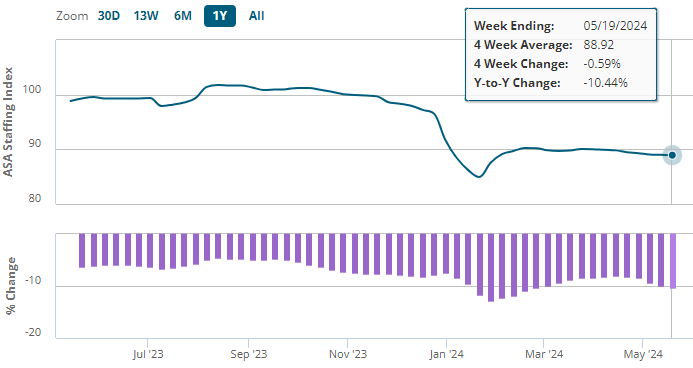
The American Staffing Association (ASA) Staffing Index shows that staffing trends are holding steady, although levels remain 10.4% lower year-over-year. We follow temporary staffing levels because short-term staffing changes typically occur before changes in full-time staffing. So far this cycle, temporary staffing has shown more weakness than unemployment insurance claims, nonfarm payrolls, and unemployment. There is little doubt that tighter monetary policy is bringing the labor market into balance.
The NAHB/Wells Fargo Housing Market Index (HMI) fell six points to 45 in May, declining for the first time since November 2023. Readings above 50 indicate favorable single-family home builder sentiment. Rising mortgage rates caused a slowdown in homebuyer activity.
The current sales conditions index fell six points to 51, the measure of sales expectations over the next six months fell nine points to 51, and the prospective buyer traffic index fell four points to 30. The NAHB Chief Economist noted that a “lack of progress on reducing inflation pushed long-term interest rates higher in the first quarter and this is acting as a drag on builder sentiment”. Regionally, the Northeast was the strongest, with a reading of 61, and the West was the weakest, with a reading of 43. The Midwest and South were both 49.
MONEY SUPPLY
The monetary base represents the total currency in the economy as well as bank reserves. The Fed is working to limit the growth of the money supply through its monetary tightening policy.
Below is the monthly update of the Marketimer and Brinker Fixed Income Advisor Model Portfolios through May 31, 2024.


