

Model Portfolios | June Update
S&P 500 5911.69 | 10-Year UST Yield 4.41% | June 1, 2025
"There is a time to go long, a time to go short, and a time to go fishing."
COMMENTARY

The S&P 500 Index has rallied impressively from its April low achieved during the initial wave of selling triggered by the ongoing trade policy changes. The index ended the month of May at the 5911.69 level, down -3.8% from the all-time closing high level of 6144.15 achieved 100 days earlier on February 19th.
Earnings revisions have lowered the S&P 500’s second-quarter estimated earnings from $65.55 to $62.91, according to FactSet. For calendar year 2025, FactSet estimates S&P 500 earnings to be just below $265, down approximately $9 from $274 at the beginning of the year. Despite the decline in earnings estimates, the stock market remains at the same levels it was trading at six months ago. At the close on Friday, May 30th, the S&P 500 was trading at 22.3 times the 2025 earnings estimate.

During the five month period from January through May 2025, the Vanguard Total Stock Market Fund (Symbol: VTSAX) has a total return of 0.5%, the Vanguard Total Bond Market Fund (Symbol: VTBLX) has a total return of 2.5%, and the Vanguard Federal Money Market Fund (Symbol: VMFXX) has a total return of 1.8%.
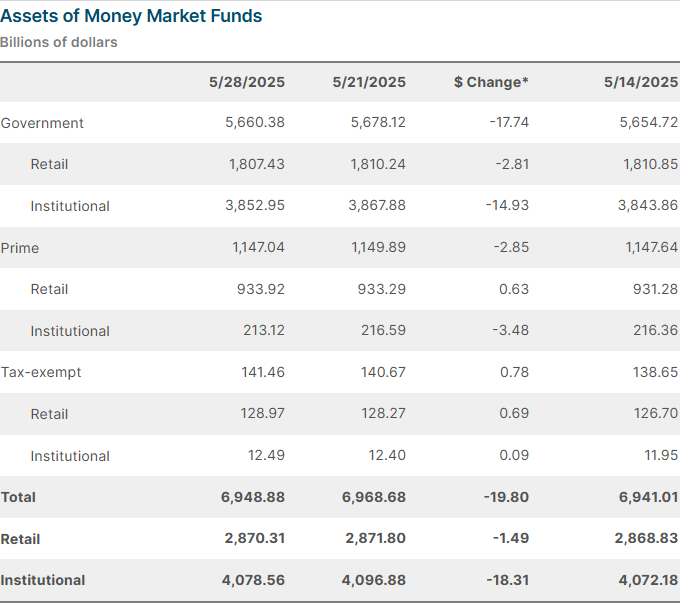
According to the Investment Company Institute (ICI), money market assets have remained stable this year, hovering around the $6.95 trillion level. This figure includes $2.87 trillion in retail accounts and $4.08 trillion in institutional accounts. Money market fund yields are relatively attractive, earning around 4.25%.
The Conference Board Leading Economic Index (LEI) fell 1.0% in April, after a 0.8% decline in March. Over the six-month period ending in April 2025, the LEI fell 2.0%, the same pace of decline as seen in the prior six months. “Widespread weaknesses were also present when looking at six-month trends among the LEI’s components, resulting in a warning signal for growth. However, while the six-month growth rate of the LEI went deeper into negative territory, it did not fall enough to trigger the recession signal.” Despite the negative readings, the Conference Board forecasts real GDP growth of 1.6% in 2025. The Conference Board CEO Confidence measure also fell in April, to the lowest level since the fourth quarter of 2022. It was the largest quarter-over-quarter decline in the survey’s history, dating back to 1976.
HOUSING MARKET UPDATE
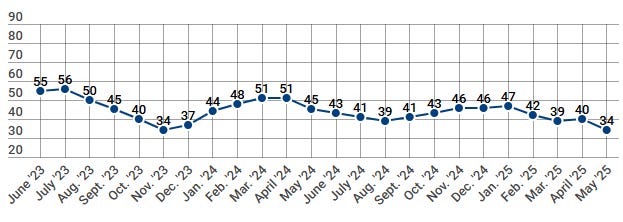
The NAHB/Wells Fargo Housing Market Index (HMI) measures conditions in the single-family housing market. The HMI index weakened in May, falling six points from 40 to 34, sinking to the lowest level since November 2023. HMI Index readings above 50 indicate favorable sentiment among single-family home builders. The current sales conditions index fell eight points to 37. The measure of sales expectations over the next six months dropped one point to 42. And, the prospective buyer traffic index declined 2 points to 23. The NAHB Chief Economist noted, “the overwhelming majority of survey responses came before the tariff reduction announcement with China. Builders expect future trade negotiations and progress on tax policy will help stabilize the economic outlook and strengthen housing demand.” Regionally, the Northeast was the strongest, falling 3 points to 44. The Midwest fell 1 point to 40. The South fell 2 points to 37. The West was the weakest, falling two points to 33. We think the recent uptick in longer-term interest rates will be an additional headwind to the housing market this summer.
The latest Housing Market Update published by Redfin indicates that we are currently in a buyer's market, with 34% more sellers in the market than buyers. Redfin forecasts home prices will decline by 1% by year-end. The number of home sellers has returned to levels not seen since March 2020, and the number of buyers is at the lowest level in their limited dataset, which goes back to 2013.
INFLATION UPDATE
The Fed’s preferred inflation measure is the personal consumption expenditures (PCE) price index. In April, the headline PCE inflation rate was 2.1% year-over-year. The core PCE inflation rate, which excludes the volatile food and energy components, was 2.5% year-over-year. The 3-month annualized core PCE inflation rate was 2.7% and the 6-month annualized core PCE inflation rate was 2.6%. Most FOMC members want to see the 3-month and 6-month core PCE inflation figures move slightly lower toward the 2% target level before lowering the fed funds rate again.

Headline PCE:
+0.1% seasonally adjusted in April, following 0.0% in March
+2.1% year-over-year
+2.1% latest 3 months annualized
+2.6% latest 6 months annualized
Core PCE: (excludes food and energy)
+0.1% seasonally adjusted in April, following 0.1% in March
+2.5% year-over-year
+2.7% latest 3 months annualized
+2.6% latest 6 months annualized
FEDERAL RESERVE UPDATE
The next Federal Open Market Committee (FOMC) Meeting is scheduled for June 17th and 18th. The meeting will include an updated Summary of Economic Projections (SEP) from FOMC members. Here is a link to their most recent March 2025 projections. We will be looking to see if the central tendency of the year-end 2025 federal funds rate projection is unchanged or slightly higher than the 3.9% to 4.4% range. We do not anticipate any monetary policy change at the June meeting.

CME FedWatch probabilities show a greater than 90% expectation of no change to the fed funds rate at the June meeting.
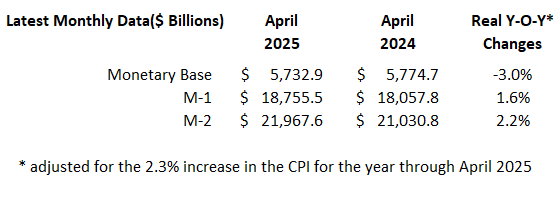
MONEY SUPPLY
MODEL PORTFOLIOS UPDATE
Below is the monthly update of the Marketimer and Brinker Fixed Income Advisor Model Portfolios through May 31, 2025.
