Model Portfolios | May Update
S&P 500 5035.69 10-Year UST Yield 4.68% :: April 30, 2024
“Risk and time are opposite sides of the same coin, for if there were no tomorrow there would be no risk. Time transforms risk, and the nature of risk is shaped by the time horizon: the future is the playing field.”
COMMENTARY
In last month’s update, we wrote, “Given the substantial stock market gains since October, a period of price consolidation or a mild pullback in equity prices would be healthy.” We think the health-restoring correction is underway. Since closing at a record high of 5254 on March 28th, the S&P 500 declined 5.5% to close at 4967 on April 19th. As you can see in the above S&P 500 weekly chart, the index rallied 28% from October 2023 through March 2024. The 47% rally since the current bull market commenced in October 2022 is even more impressive.
Investor sentiment is now in the process of resetting. The National Association of Active Investment Managers (NAAIM) Exposure Index peaked in March at 104.75. The index has since declined to 59.48. During prior stock market correction lows, this index moved toward 20.
The American Association of Individual Investors (AAII) Investor Sentiment Survey recently showed bullish investor sentiment had fallen from 47.3% at the start of April to 32.1% at the end of the month. Bearish sentiment increased from 22.2% to 33.9% during the same period. Around last year’s correction low in October, AAII bearish sentiment rose to more than 50%.
The NAHB/Wells Fargo Housing Market Index (HMI) was unchanged at 51 in April, following four months of rising figures. Readings above 50 indicate favorable single-family home builder sentiment. Higher mortgage rates are resulting in a slowdown in homebuyer activity.
The current sales conditions index rose one point to 57, the measure of sales expectations over the next six months fell two points to 60, and the prospective buyer traffic index rose one point to 35. The NAHB Chief Economist noted that “buyers are hesitating until they can better gauge where interest rates are headed”. Regionally, the Northeast was the strongest, with a reading of 63, and the Midwest was the weakest, with a reading of 46.
INFLATION UPDATE
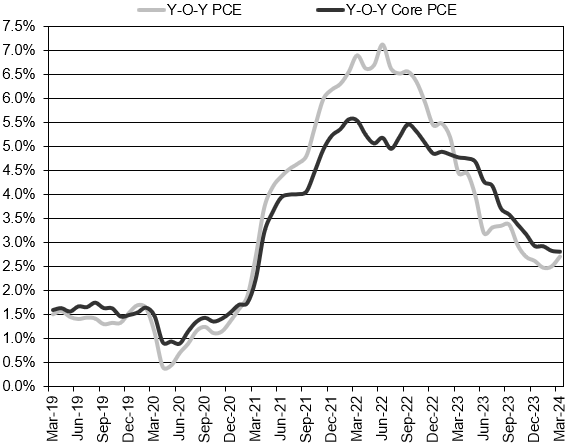
The personal consumption expenditure (PCE) inflation report showed the PCE price index increased 0.3% in March. The core PCE, which excludes the food and energy components, also rose 0.3% during the month.
The pace of headline PCE inflation rose from 2.5% to 2.7% year-over-year in March. The core PCE rate was unchanged year-over-year at 2.8%. Both the three-month headline PCE inflation rate and the three-month core-PCE inflation rate continued to move higher in March. The three-month headline PCE annualized rate rose from 3.6% to 4.4% and the three-month core-PCE annualized rate increased from 3.7% to 4.4%. These inflation readings are too high, and they take FOMC rate cuts off the table for the foreseeable future. Nearly all FOMC members are uncomfortable lowering the fed funds rate as long as the three-month inflation rate is above 3.0%.
Headline PCE:
+0.3% seasonally adjusted in March, following 0.3% in February
+2.7% year-over-year
+4.4% latest 3 months annualized
+2.5% latest 6 months annualized
Core PCE: (excludes food and energy)
+0.3% seasonally adjusted in March, following +0.3% in February
+2.8% year-over-year
+4.4% latest 3 months annualized
+3.0% latest 6 months annualized
FEDERAL RESERVE UPDATE
The FOMC held a two-day meeting on April 30th and May 1st. As expected, there was no change to the federal funds rate at this week’s meeting. In the post-meeting statement, FOMC officials noted that “In recent months, there has been a lack of further progress toward the Committee’s 2 percent inflation objective.” More importantly, FOMC members are rethinking their forecast to lower rates this year. The statement says “The Committee does not expect it will be appropriate to reduce the target range until it has gained greater confidence that inflation is moving sustainably toward 2 percent.”
The Fed is going to begin slowing down the pace of its quantitative tightening (QT) program which reduces the overall size and scope of the Fed’s balance sheet. Starting in June, the New York Fed will lower the redemption cap on U.S. Treasury security holdings from $60 billion per month to $25 billion per month. The $35 billion monthly cap on agency mortgage-backed securities (MBS) will remain in place. This reduces the pace of balance sheet reduction from $95 billion per month to $60 billion per month. The Fed’s balance sheet has already declined from $9 trillion to $7.4 trillion.
Following the FOMC meeting, Chair Powell hosted a press conference, which you can watch here, or read a PDF transcript here.
The next FOMC meeting is scheduled for June 11th and 12th, and it will include an updated Summary of Economic Projections from FOMC members.
MONEY SUPPLY
Below is the monthly update of the Marketimer and Brinker Fixed Income Advisor Model Portfolios through April 30, 2024.


