

Model Portfolios | May Update
S&P 500 5569.06 | 10-Year UST Yield 4.17% | April 30, 2025
“It ain’t what you don’t know that gets you into trouble. It’s what you know for sure that just ain’t so.”
-Mark Twain

COMMENTARY

According to the advance GDP report, real gross domestic product (GDP) decreased at a -0.3% annual rate in the first quarter of 2025, following a 2.4% pace of growth in the fourth quarter of 2024. During the previous four quarters, real GDP growth averaged 2.1%, close to our long-term 2% trend growth rate estimate.
Personal consumption expenditures (PCEs) are the most significant component within the GDP report, representing nearly 70% of total GDP. During the first quarter, PCEs contributed 1.2% to the overall GDP figure, as consumer spending decelerated from the heightened pace seen in the prior quarter. Gross private investment added 3.6%, reversing the fourth-quarter’s -1.0% figure. Net exports were deeply negative, subtracting -4.8% from GDP, and government consumption expenditures subtracted -0.25%. View a more detailed GDP contribution breakdown in Table 2 of the GDP report. The dramatic changes to USA trade policy will have a major impact on GDP this year, as businesses and consumers adjust their behavior.
This month we are updating our key indicators that measure the risk of recession. These include: (1) accelerating inflation; (2) payroll growth; (3) inverted yield curve; (4) rising unemployment claims; and (5) the Leading Economic Index.
Accelerating Inflation: Year-over-year inflation figures remain above the Fed’s 2% target level, and recent trade policy changes may keep inflation elevated into the summertime. Fed Chair Powell has indicated most FOMC members are comfortable holding the fed funds rate steady, adopting a wait-and-see approach to future monetary policy decisions. See the full inflation report in more detail below.
Payroll Growth: The unemployment rate in the March labor report was 4.2%. The rate has been steady within a narrow range of 4.0% to 4.2% since May 2024. Total nonfarm payrolls rose 228k in March, higher than the 12-month average gain of 158k. The healthy pace of job growth allows the Fed to focus on its goal of lowering the pace of inflation to its 2% target level.
Inverted Yield Curve: The yield curve measures the current yield on Treasuries over the range of maturities. The yield curve’s slope shows the term structure of rates and indicates the economy’s health. Term structure refers to the interest rates of similar bonds across the maturity spectrum. An ascending yield curve indicates investors expect rates to increase with economic growth. We focus on the yield curve measure included in the Leading Economic Index to determine whether there is an inversion, and we watch for inversions that persist for at least six months. As we enter May, the effective federal funds rate is 4.33% and the 10-year Treasury yield is 4.17%, resulting in a slightly inverted yield curve of -16 basis points.
Rising Unemployment Claims: Weekly unemployment insurance claims have been relatively stable, hovering near record lows around 220,000. This is impressive considering the growth in the labor force over time. Given our nation’s aging demographics and a reduction in immigration, labor market conditions may remain relatively tight for the foreseeable future. These conditions increase the resolve of employers to retain productive workers. The March JOLTS report showed that the quits rate was 2.1% and there were 7.2 million job openings, down about 901,000 from a year ago.
Leading Economic Index: The Conference Board Leading Economic Index (LEI) declined 0.7% in March, after a 0.2% decline in February. Over the six-month period ending in March 2025, the LEI fell 1.2%, an improvement from its 2.3% decline over the prior six months. “March’s decline was concentrated among three components that weakened amid soaring economic uncertainty ahead of pending tariff announcements: 1) consumer expectations dropped further, 2) stock prices recorded their largest monthly decline since September 2022, and 3) new orders in manufacturing softened.” Despite the negative readings, the Conference Board forecasts real GDP growth of 1.6% in 2025.
INFLATION UPDATE
The Fed’s preferred inflation measure is the personal consumption expenditures (PCE) price index. In March, the headline PCE inflation rate was 2.3% year-over-year. The core PCE inflation rate, which excludes the volatile food and energy components, was 2.6% year-over-year. The 3-month annualized core PCE inflation rate was 3.5% annualized and the 6-month annualized core PCE inflation rate was 3.0%. Most FOMC members want to see the 3-month and 6-month core PCE inflation figures move lower toward the 2% target level before lowering the fed funds rate again. The recent uptick in these inflation measures has put rate cuts on hold.

Headline PCE:
+0.0% seasonally adjusted in March, following 0.4% in February
+2.3% year-over-year
+3.1% latest 3 months annualized
+2.9% latest 6 months annualized
Core PCE: (excludes food and energy)
+0.0% seasonally adjusted in March, following 0.5% in February
+2.6% year-over-year
+3.5% latest 3 months annualized
+3.0% latest 6 months annualized
HOUSING MARKET UPDATE
The NAHB/Wells Fargo Housing Market Index (HMI) measures conditions in the single-family housing market. The index rose one point in April from 39 to 40, pausing its decline from 47 in January. HMI Index readings above 50 are indicative of favorable single-family home builder sentiment. The current sales conditions index rose two points to 45, the measure of sales expectations over the next six months dropped four points to 43, and the prospective buyer traffic index rose one point to 25. The NAHB Chief Economist noted that “builders have expressed growing uncertainty over market conditions as tariffs have increased price volatility for building materials at a time when the industry continues to grapple with labor shortages and a lack of buildable lots.” Regionally, the Northeast fell 7 points to 47. The South fell three points to 39. The Midwest fell one point to 41, and the West fell two points to 35.

FEDERAL RESERVE UPDATE
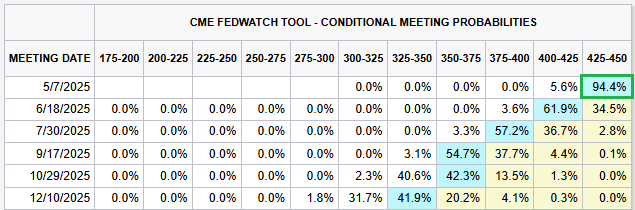
The Federal Open Market Committee (FOMC) is scheduled to meet next week on May 6th and 7th. As of this writing, there is a greater than 90% probability that rates remain unchanged at the meeting, according to CME FedWatch. Investors anticipate that another rate cut will come at the June 18th FOMC meeting. That could happen, but there has been little indication from Fed Chair Powell that another rate cut is imminent. At recent media events, Chair Powell has emphasized that FOMC members are comfortable with their current policy stance and will likely wait for the incoming inflation data to improve before lowering the federal funds rate again. It would take a rapid deterioration in the labor market figures for the Fed to lower rates while inflation remains elevated.
MONEY SUPPLY

MODEL PORTFOLIOS UPDATE
Below is the monthly update of the Marketimer and Brinker Fixed Income Advisor Model Portfolios through April 30, 2025.
