Model Portfolios | November Update
S&P 500 5705.45 10-Year UST Yield 4.28% :: October 31, 2024
“The investor's chief problem, even his worst enemy, is likely to be himself.”
GROSS DOMESTIC PRODUCT (GDP)
Real gross domestic product (GDP) increased at a 2.8% annualized rate during the third quarter of 2024, following a 3.0% pace of growth in the second quarter. During the first nine months of 2024, real GDP growth averaged 2.5%, just above our long-term trend growth rate estimate of 2%.
Personal consumption expenditures (PCEs) are the most significant component within GDP, representing nearly 70% of the overall GDP figure. During the third quarter, PCEs contributed 2.5% to the overall 2.8% figure, an improvement from their 1.9% contribution in the second quarter. Gross private investment contributed just 0.1%. Net exports subtracted -0.6%, and government consumption expenditures added 0.85%. View a more detailed real GDP contribution breakdown in Table 2 of the report.
Looking ahead to the fourth quarter, the Atlanta Fed GDPNow model has an initial forecast of 2.7%. The New York Fed Nowcast estimates fourth quarter growth at 2.5%.
HOUSING MARKET
The NAHB/Wells Fargo Housing Market Index (HMI) measures conditions in the single-family housing market. The index rose for the second month, rising two points to 43 in October. HMI Index readings above 50 are indicative of favorable single-family home builder sentiment. The October report noted that 32% of builders are cutting prices to boost home sales, the same as the previous month. The current sales conditions index increased two points to 47, the measure of sales expectations over the next six months increased four points to 57, and the prospective buyer traffic index rose two points to 29. The NAHB Chief Economist commented that despite “the beginning of the Fed’s easing cycle, many prospective home buyers remain on the sideline waiting for lower interest rates”. Regionally, the Northeast was the strongest, rising two points to 51. The West, Midwest, and South regions were all the same at an index level of 41.
INFLATION UPDATE
The Fed’s preferred inflation measure is the personal consumption expenditure (PCE) price index. The most recent PCE report showed the index was up 0.2% in September. The core PCE, which excludes the food and energy components, rose 0.3% in September.
The chart above shows that the headline and core PCE inflation rates have decelerated since mid-2022. The most recent three-month annualized headline PCE inflation rate is 1.8%, and the three-month annualized core-PCE rate is 2.3%. These three-month inflation figures are close to the Fed’s 2% inflation target and support a rate cut at next week’s FOMC meeting.
Headline PCE:
+0.2% seasonally adjusted in September, following 0.1% in August
+2.1% year-over-year
+1.8% latest 3 months annualized
+1.7% latest 6 months annualized
Core PCE: (excludes food and energy)
+0.3% seasonally adjusted in September, following +0.2% in August
+2.7% year-over-year
+2.3% latest 3 months annualized
+2.3% latest 6 months annualized
FEDERAL RESERVE UPDATE
The Federal Open Market Committee (FOMC) meets on November 6th and 7th next week, following the election on Tuesday, November 5th. We expect FOMC members will lower the fed funds rate by 25 basis points to a target range of 4.5% to 4.75%. The final FOMC meeting of 2024 is scheduled for December 17th and 18th.
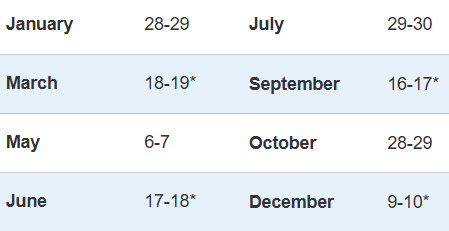
The Fed has published the following 2025 FOMC meeting schedule. The *asterisks indicate the four meetings that will include an updated Summary of Economic Projections (SEP).
MONEY SUPPLY
MODEL PORTFOLIOS UPDATE
Below is the monthly update of the Marketimer and Brinker Fixed Income Advisor Model Portfolios through October 31, 2024.
**On Monday, November 4th, we will make several changes to our portfolio holdings, detailed below.**


