

“If something cannot go on forever, it will stop.”
COMMENTARY
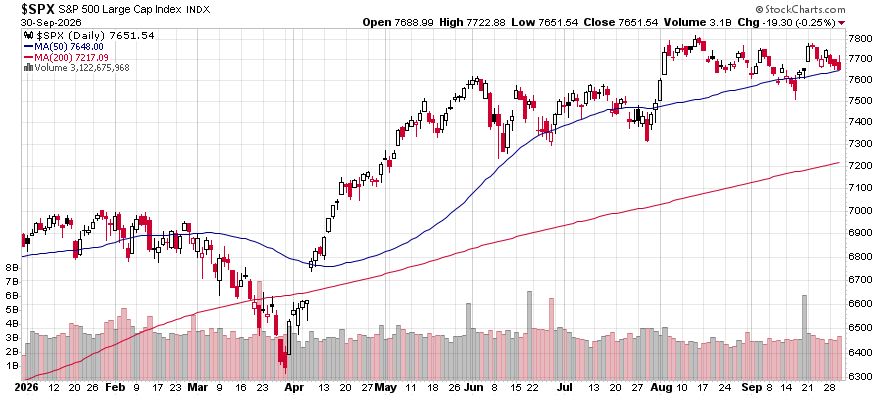
The S&P 500 index closed at 7,651.54 on September 30, 2026, down 1.9% from its record close of 7,798.99 on August 13. Elevated oil prices, along with the FOMC’s decision to raise the federal funds rate, led to a brief 2.5% pullback in mid-September, from which the market rebounded over the following two weeks. Following its April and May rally, the S&P 500 has traded roughly flat since June 1. The tech-weighted Nasdaq Composite set a new all-time high of 27,244.28 on September 22 and closed September at 26,861.06, 1.4% below that high.
Long-term Treasury yields rose sharply in September. The ten-year yield reached 5.00% on September 15, the day before the FOMC decision, and closed September 30 at 5.29%, up from 4.75% on August 31. The thirty-year yield closed at 5.64%, up from 5.25% over the same period, and the two-year yield rose to 4.88%, from 4.34%, nearly a full percentage point above the top of the new 3.75% to 4.00% federal funds target range. The increase has come almost entirely from real yields. The ten-year Treasury inflation-protected (TIPS) yield rose to 2.93% on September 30 from 2.44% on August 31, while the implied inflation breakeven edged up to 2.36% from 2.31%.
Real GDP grew at a 2.2% annual rate in the second quarter, revised up from 1.5%, according to the latest Bureau of Economic Analysis (BEA) report. The New York Fed's GDP Nowcast forecasts 2.3% growth for third-quarter real GDP, with the estimate largely unchanged from the prior week. The Atlanta Fed's GDPNow estimate is higher at 3.7%, down from 5.0% on September 25, as weaker projected consumer spending growth and a larger drag from net exports more than offset stronger private investment. We continue to forecast real GDP growth of roughly 2% in 2026 and 2027.
The Conference Board's Leading Economic Index (LEI) decreased 0.1% in August to 99.5, the first monthly decline since March. Over the six months ending in August, the LEI has been mostly stable, slipping by just 0.1% compared with a 0.6% decline over the previous six months. The six-month growth rate remained above the threshold that triggers the LEI's recession signal. August's weakness came from consumer expectations and building permits. The Conference Board maintained its 2026 real GDP growth forecast of 1.9% and lowered its 2027 forecast to 1.8% from 1.9%.
Speculative leverage remains elevated, with margin debt increasing 2.6% from July to $1.45 trillion in August, just below the record $1.50 trillion reached in June. The elevated level of margin debt is one reason we continue to recommend patience before making new equity commitments.
EMPLOYMENT UPDATE
The August Employment Report showed a pickup in payroll growth and upward revisions to the prior two months. Total nonfarm payroll employment rose 162,000 in August, and payroll gains averaged 71,000 during the three months ending in August. Revisions to the prior two jobs reports were positive, with June revised up 11,000 and July up 44,000, leaving job growth 55,000 higher than previously reported. The unemployment rate was unchanged at 4.1%, while the labor force participation rate edged up to 61.6%. Job gains were concentrated in food services, which added 59,000 jobs, and in local government education, which added 42,000 jobs. These figures remain consistent with a low-hiring, low-firing labor market.

Average hourly earnings rose 0.3% in August and are up 3.1% year-over-year, below the 3.4% year-over-year increase in the headline consumer price index (CPI). Initial unemployment claims fell to 197,000 in the week ending September 19, while the four-week moving average declined to 202,250.
The August Job Openings and Labor Turnover Survey (JOLTS) showed little change in hiring and separations. Job openings were little changed at 7.1 million in August, while the job openings rate edged down to 4.3%. The July estimate was revised up 64,000 to 7.3 million. Hires changed little at 5.2 million, with a hiring rate of 3.3%, while total separations were unchanged at 5.1 million. The quits rate held at 1.9%, and the layoffs and discharges rate was unchanged at 1.0%.
HOUSING MARKET UPDATE
The NAHB/Wells Fargo Housing Market Index (HMI) measures conditions in the single-family housing market. The index fell three points in September to 32, its lowest level since September 2025 and well below the 50 threshold that signals favorable sentiment among builders. September marked the seventeenth consecutive month in which the index was below 40, consistent with a soft single-family housing market.
The latest HMI survey showed that 38% of builders cut prices in September, up from 35% in August. At least 30% of builders have cut prices for seventeen straight months. The average price reduction remained 6% for the sixth consecutive month. The use of sales incentives rose to 66% from 63%, the highest reading since 67% in December 2025 and the eighteenth consecutive month at 60% or higher.
The current sales conditions index fell four points to 35. The sales expectations index dropped six points to 37, while the buyer traffic index remained at 23. NAHB said that buyer traffic has weakened across much of the country because of rising mortgage rates, while tight lending conditions and elevated land, labor, and construction costs continue to weigh on builder confidence. Regional HMI readings are three-month moving averages. The Northeast fell five points to 39, while the Midwest and South each fell one point, to 44 and 31, respectively. The West rose one point to 28.

The Census Bureau reported that total housing starts declined 2.6% in August to an annual rate of 1.275 million, 1.2% below the August 2025 rate. The July rate was revised up to 1.309 million from the 1.239 million reported last month. Single-family starts rose 7.6% to 918,000, up 5.2% year-over-year, while starts in buildings with five or more units were at an annual rate of 344,000. Building permits, a leading indicator of future construction activity, declined 2.7% to a 1.394 million annual rate but were 3.5% higher than a year ago. Single-family permits fell 1.8% to 878,000, 1.3% above the August 2025 level.
New home sales increased in August. Sales of new single-family houses reached a seasonally adjusted annual rate of 684,000, up 6.4% from the revised July rate of 643,000 and 2.0% below the August 2025 rate. The median sales price of new houses sold in August was $393,700. New home inventory remains elevated at 483,000 homes for sale, which represents 8.5 months of supply, above the 4 to 6 months generally considered healthy.
INFLATION UPDATE
The headline personal consumption expenditures (PCE) price index increased 3.4% over the twelve-month period ending in August, the same rate as in July. The core PCE inflation rate, which excludes volatile food and energy components, held at 3.0% year-over-year. On a month-over-month basis, headline PCE rose 0.3%, while core PCE increased 0.2%. The July headline and core PCE rates were revised down from 3.7% and 3.3% in the annual update of the national accounts released with the report.
The consumer price index (CPI) held at 3.4% in August, matching the July reading. Core CPI, which excludes food and energy, eased to 2.4% from 2.5% in July. The 0.4% monthly increase in headline CPI was driven primarily by energy, with the energy index rising 2.1% in August. Shelter costs rose 0.3% in August and are up 3.0% over the last year. The Cleveland Fed's trimmed-mean CPI increased 2.6% year-over-year in August. The Dallas Fed's trimmed-mean PCE increased 2.2% year-over-year in August, down from 2.3% in July.

Headline PCE:
+0.3% month-over-month seasonally adjusted
+3.4% year-over-year
Core PCE: (excludes food and energy)
+0.2% month-over-month seasonally adjusted
+3.0% year-over-year
Subscriber Note: Our “Economic Dashboard” tracks the key economic indicators we regularly monitor. You can access it anytime here: https://econ.brinkeradvisor.com/
FEDERAL RESERVE UPDATE
At the September 15-16 meeting, FOMC members voted 12-0 to raise the federal funds target range by a quarter point to 3.75% to 4.00%. The unanimous vote was a shift from July's 9-3 decision to hold rates steady, when three members dissented in favor of a quarter-point increase.
The Summary of Economic Projections (SEP) released with the statement shows a central tendency for the federal funds rate of 4.1% to 4.4% at the end of 2026, up from 3.6% to 4.1% in June. The central tendency, which excludes the three highest and three lowest projections, indicates that one more rate hike is likely this year. All but two of the 18 FOMC participants forecast at least one more rate hike by the end of 2026. The central tendency for the end of 2027 is 3.6% to 4.4%, up from 3.1% to 3.9%, indicating a few more rate hikes next year. The central tendency for 2026 real GDP growth increased to 2.2% to 2.4% from 2.0% to 2.3%, while the projection for the 2026 unemployment rate declined to 4.1% to 4.2% from 4.3% to 4.4%. The central tendency for 2026 PCE inflation was unchanged at 3.5% to 3.7%, while the core PCE projection narrowed to 3.3% to 3.4% from 3.2% to 3.5%.

Below is the full monetary policy statement following the September FOMC meeting:
The Committee decided to raise the target range for the federal funds rate by 1/4 percentage point to 3.75% to 4.00%, in support of the Federal Reserve's dual mandate. The Committee is continuing its policy of maintaining ample reserves in the banking system.
Economic activity is expanding at a solid pace. While uncertainty remains elevated owing, in part, to geopolitical developments, domestic spending has been resilient. Productivity growth is strong, and capital investment is robust. Job gains have kept pace with the workforce, and the unemployment rate has changed little.
Inflation remains elevated. Today's policy action will support a timelier return to the Committee's 2 percent goal. The Committee will deliver price stability.
Following the September FOMC meeting, Fed Chair Warsh hosted a press conference. You can watch the press conference below or read the transcript PDF here.
At his post-meeting press conference, Chair Warsh emphasized that inflation has remained above target for more than five years and price stability is the Committee's predominant focus. He described the labor market as a source of strength, citing an unemployment rate of around 4.1% and claims consistent with full employment.
The next FOMC meeting is scheduled for October 27-28. As of October 1, CME FedWatch probabilities show a 32% chance of a quarter-point rate hike at the October meeting and a 68% chance of no change, with zero probability assigned to a rate cut. FedWatch probabilities show an 85% chance of at least one more quarter-point hike by the December meeting, consistent with the SEP central tendency. The probability of two or more rate hikes by the January 2027 meeting stands at 54%.

NATIONAL DEBT UPDATE
The total federal debt surpassed $40 trillion on August 18, 2026, nearly double its year-end 2017 level, and stood at $40.10 trillion on September 3. Over the past twelve months, the debt increased by $2.67 trillion, averaging $7.35 billion per day. At $40.10 trillion, the debt equals 123% of second-quarter nominal GDP of $32.56 trillion and is nearly twice the size of China’s projected 2026 economy of $20.8 trillion.

Net interest on the debt totaled $1.017 trillion during the first 11 months of fiscal year 2026, the first time annual net interest has exceeded $1 trillion in a fiscal year. Interest spending now exceeds national defense spending of $832.63 billion over the same period and accounts for 14.9% of federal outlays. Net interest has nearly tripled from $345 billion in fiscal year 2020. Federal receipts totaled $4.845 trillion over the same eleven months, meaning interest now accounts for approximately 21% of federal receipts.

The average interest rate on total marketable Treasury debt increased to 3.475% in August, up from 1.432% at the end of 2021. The Government Accountability Office (GAO) reported that, as of September 2025, 33% of marketable debt was scheduled to mature within the following twelve months, up from 24% in September 2014. Because the Treasury refinances maturing debt at current market rates, higher yields and the September rate increase flow into federal interest costs. The Congressional Budget Office (CBO) projects that net interest will reach a record 3.3% of GDP in 2026 and rise to $2.1 trillion by 2036. The CBO projections assumed a ten-year Treasury note yield of 4.1% for 2026. The Committee for a Responsible Federal Budget estimates that interest rates one percentage point above the CBO path would add $3.5 trillion to the debt over the next decade.


Demand at Treasury auctions weakened in September. On September 23, the Treasury sold $70 billion of five-year notes at a yield of 5.033%, up from 4.393% at the August auction. Investors submitted bids for 2.21 times the amount offered, down from 2.37 times in August. Indirect bidders, which include foreign central banks, bought 54.3% of the notes, down from 61.5% in August. The two-year note auction on September 22 drew average demand, with $69 billion sold at a yield of 4.787%. In its August refunding announcement, the Treasury said it expects to maintain note and bond auction sizes at current levels for at least the next several quarters.

MONEY SUPPLY
MODEL PORTFOLIOS UPDATE
Below is the monthly update of the Marketimer and Brinker Fixed Income Advisor Model Portfolios through September 30, 2026.
