Model Portfolios | December Update
S&P 500 6032.38 10-Year UST Yield 4.17% :: December 1, 2024
“Riches are not an end of life, but an instrument of life.”
- Henry Ward Beecher
COMMENTARY
The S&P 500 continues to probe new record highs as the index sits just above the 6000 level, ending November at a closing high of 6032.38. So far this year the S&P 500 has increased 26.5%. As shown in the chart above, there has been relatively little selling pressure this year, besides three weeks in April and three weeks in July. Since bottoming in early August 2024, the S&P 500 has increased 17% in just under four months. Looking back to the October 2022 bottom, the S&P 500 has rallied 70% in a little over two years.
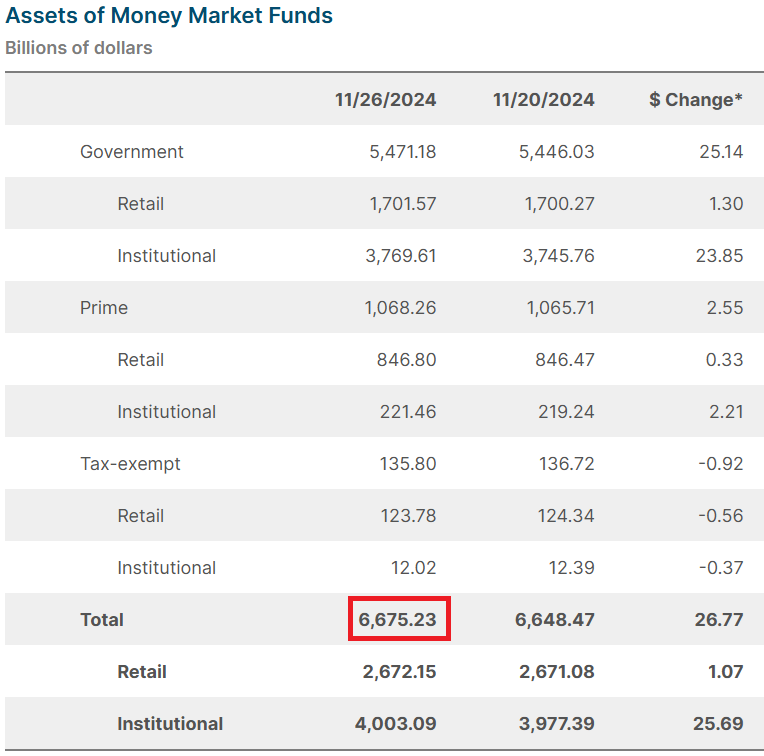
Despite the relentless rise in stock prices in 2023 and 2024, assets held in money market funds continue to increase. At the end of November, ICI reported $6.675 trillion invested in money funds, including $2.67 trillion in retail funds and $4.0 trillion in institutional funds.
HOUSING MARKET
The NAHB/Wells Fargo Housing Market Index (HMI) measures conditions in the single-family housing market. The index rose three points in November to 46 and is up seven points over the past three months. HMI Index readings above 50 are indicative of favorable single-family home builder sentiment. The current sales conditions index increased two points to 49, the measure of sales expectations over the next six months increased seven points to 64, and the prospective buyer traffic index rose three points to 32. The NAHB Chief Economist noted that although “builder confidence is improving, the industry still faces many headwinds such as an ongoing shortage of labor and buildable lots along with elevated building material prices”. Regionally, the Northeast was the strongest, rising four points to 55. The Midwest rose three points to 44, and the South rose one point to 42. The West held steady, unchanged at 41.
INFLATION UPDATE
The Fed’s preferred inflation measure is the personal consumption expenditure (PCE) price index. The most recent PCE report showed the index was up 0.2% in October. The core PCE, which excludes the food and energy components, rose 0.3% in October.
The chart above shows that the year-over-year core PCE inflation rate has been moving sideways for six months between 2.6% and 2.9%. The most recent three-month annualized headline PCE inflation rate is 2.2%, and the three-month annualized core-PCE rate is 2.8%. Additional fed funds rate cuts may be delayed if the core PCE inflation rate remains stuck around current levels.
Headline PCE:
+0.2% seasonally adjusted in October, following 0.2% in September
+2.3% year-over-year
+2.2% latest 3 months annualized
+1.6% latest 6 months annualized
Core PCE: (excludes food and energy)
+0.3% seasonally adjusted in October, following +0.2% in September
+2.8% year-over-year
+2.8% latest 3 months annualized
+2.3% latest 6 months annualized
FEDERAL RESERVE UPDATE
The Federal Open Market Committee (FOMC) meets on December 17th and 18th. The latest CME FedWatch probabilities favor a 25-basis-point rate cut at the meeting. The December meeting includes an updated Summary of Economic Projections. If the inflation data continues to come in stronger than expected, the Fed will slow the pace of rate cuts in 2025.
MONEY SUPPLY
MODEL PORTFOLIOS UPDATE
Below is the monthly update of the Marketimer and Brinker Fixed Income Advisor Model Portfolios through November 30, 2024.
We made several changes to our Model Portfolios in November. Subscribers can read about the Model Portfolio Updates here.


