

“Well done is better than well said.”
COMMENTARY
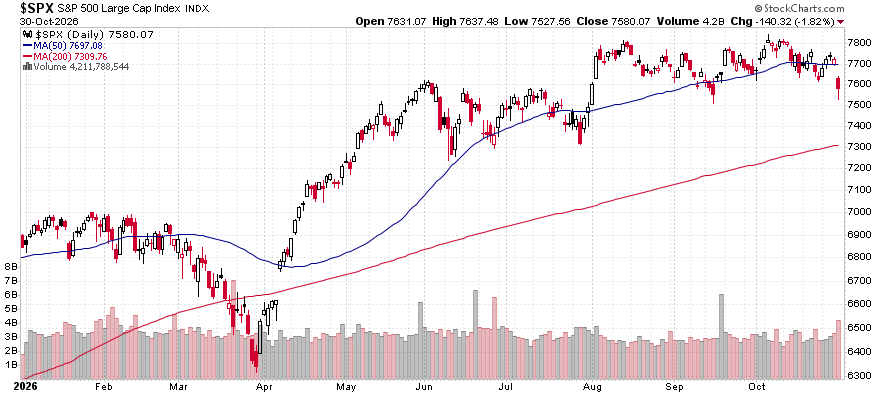
The S&P 500 closed at 7,580.07 on October 30, 2026, 3.1% below its record close of 7,818.93 set on October 6. Technology and AI-related stocks led the decline as investors grew more concerned about the scale of AI spending and the debt financing behind it, while a hotter-than-expected September inflation report raised expectations for another Fed rate increase. The tech-weighted Nasdaq Composite closed at 25,437.00, 7.8% below its record close of 27,599.89, also set on October 6.
The October pullback has reshaped the market breadth story this year. At the end of September, the S&P 500 had outperformed the S&P 500 Equal Weight Index, which weights each company equally, by more than 3% year-to-date. However, in October the S&P 500 fell 0.9%, bringing its year-to-date return to 10.7%, while the S&P 500 Equal Weight Index rose 4.9% and is up 13.9% year-to-date.
Market concentration remains well above typical historical levels. The ten largest companies in the S&P 500 accounted for 39.1% of the index’s total market value at the end of September. Before the current cycle, the last time the ten largest companies held a similar weight was in the mid-1960s; those companies lost most of their index weight over the following decades, and the S&P 500 returned 1.2% per year on a price basis over the next ten years. We discuss what this means for investors, including record household equity exposure, in the Marketimer section below.
Speculative leverage remains elevated, with margin debt increasing 1.8% from August to $1.48 trillion in September, just below the record $1.50 trillion reached in June. Margin debt is up 31.4% year-over-year. This combination of factors is one reason we continue to recommend patience before making new equity commitments.
The Conference Board’s Leading Economic Index (LEI) was unchanged in September at 99.6, following a 0.1% decline in August. Five of the ten components rose, led by the interest rate spread and average weekly hours in manufacturing, while consumer expectations fell. The LEI rose 0.6% over the six months ending in September, and the Conference Board said the index shows no recession signal. It expects real GDP to grow 2.2% in 2026 and 2.0% in 2027.
Subscriber Note: Thank you to all subscribers who responded to our October audience survey. We have read your feedback and are developing new Brinker Advisor platform features and content to include in your existing subscription at no additional cost. For those who haven't already, subscribers can still respond to the two-question survey here.
GDP UPDATE
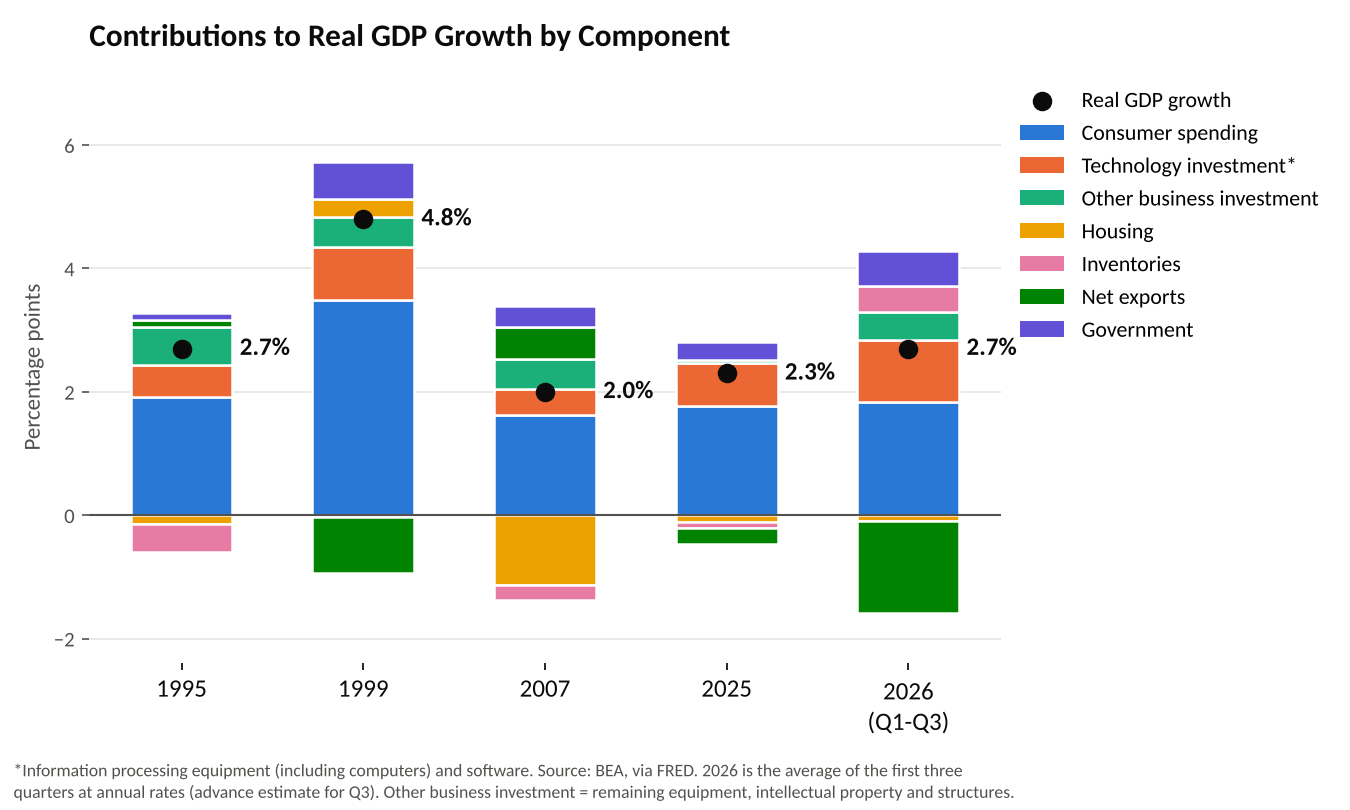
Real gross domestic product (GDP) grew at a 3.4% annual rate in the third quarter of 2026, up from 2.2% in the second quarter, according to the latest Bureau of Economic Analysis (BEA) report. Quarterly real GDP growth has averaged a 2.7% annual rate over the first three quarters of 2026.


Personal consumption expenditures, which account for nearly 70% of GDP, contributed 2.52 percentage points to third-quarter growth, about the same as in the second quarter. Gross private domestic investment added 3.27 percentage points, led by inventories and equipment, and government spending added 0.90 percentage points. Net exports subtracted 3.32 percentage points, as exports fell and imports, led by capital goods, rose.
Business investment has become the largest source of growth outside the consumer. Through the first three quarters of 2026, investment in information processing equipment and software added an average of 1.0 percentage point to real GDP growth, or about 37% of the total, up from about 30% in 2025. During the technology boom of the late 1990s, the same categories contributed a similar 0.78 to 0.85 percentage points a year, but real GDP grew 4.4% to 4.8% a year, so technology investment accounted for less than a fifth of growth.
The rest of the economy is growing more slowly than it did in the late 1990s, when consumer spending added about 3.5 percentage points a year to growth, roughly double its 1.8 percentage points in 2025. In composition, today’s economy more closely resembles 1995 and 2007, when residential investment subtracted from growth and technology investment accounted for about a fifth of growth.
The New York Fed’s GDP Nowcast forecasts 2.9% growth for fourth-quarter real GDP, revised upwards from the October 2 estimate of 2.5%. The Atlanta Fed’s initial GDPNow estimate is even higher at 3.2%. Following the strong third-quarter report, we have raised our 2026 real GDP growth forecast to roughly 2.5%.
EMPLOYMENT UPDATE
The September Employment Report showed slower payroll growth and downward revisions to the prior two months. Total nonfarm payroll employment rose 29,000 in September. The unemployment rate edged up 0.1 percentage point to 4.2%, while the labor force participation rate rose 0.2 percentage point to 61.8%. Revisions to the prior two jobs reports were negative, with July revised down 31,000 and August down 29,000, leaving job growth 60,000 lower than previously reported.

Average hourly earnings rose 0.1% in September and are up 3.0% year-over-year, below the 3.7% year-over-year increase in the headline consumer price index (CPI). September marks the sixth straight month in which average hourly earnings growth has trailed headline CPI. The Employment Cost Index (ECI) measures changes in wages, salaries, and employer benefit costs. Compensation costs for civilian workers increased 0.8% in the third quarter, with wages and salaries up 0.7% and benefit costs up 0.9%. Over the twelve months ending in September, wages and salaries rose 3.1%, while benefit costs rose 3.9%, and inflation-adjusted wages and salaries fell 0.6%. Weekly initial jobless claims were 194,000 in the week ended October 24 and remain at historically low levels. These labor market figures are consistent with a low-hiring, low-firing labor market.
HOUSING MARKET UPDATE
The NAHB/Wells Fargo Housing Market Index (HMI) measures conditions in the single-family housing market. The index fell three points in October to 29, its lowest level since June 2012 and well below the 50 threshold that signals favorable sentiment among builders. The latest HMI survey showed that 43% of builders cut prices in October, the highest share during the 2020 to 2026 period. The average price reduction remained 6% for the seventh consecutive month. About 65% of builders used sales incentives in October, the 19th consecutive month this share has reached 60% or higher.
All three major HMI components declined in October. The current sales conditions index fell two points to 33, the sales expectations index dropped five points to 32, and the buyer traffic index fell five points to 18, its lowest level since April 2012 apart from the onset of the pandemic in April 2020. NAHB said that mortgage rates well above 7%, higher costs for construction loans, building materials and diesel, and weaker consumer confidence continue to weigh on builder confidence. Regionally, based on three-month moving averages, the Northeast fell one point to 38, the Midwest fell three points to 40, the South fell one point to 30, and the West fell two points to 26.

The Census Bureau reported that housing starts fell 5.2% in September to a seasonally adjusted annual rate of 1,221,000, 7.4% below the September 2025 rate. Single-family starts fell 4.6% to 859,000, while starts in buildings with five units or more came in at an annual rate of 349,000. Building permits, a leading indicator of future construction activity, edged down 0.2% to a 1,400,000 annual rate, 3.0% below the September 2025 level.
New home sales declined slightly in September. Sales of new single-family houses fell 0.6% from the revised August rate to a seasonally adjusted annual rate of 676,000, 5.3% below the September 2025 level. New home inventory remains elevated at 476,000 homes for sale, which represents 8.4 months of supply, above the 4 to 6 months generally considered healthy.
INFLATION UPDATE
The headline personal consumption expenditures (PCE) price index increased 3.6% over the twelve-month period ending in September, up from 3.4% in August. Core PCE inflation, which excludes volatile food and energy components, rose to 3.1% from 3.0%. On a month-over-month basis, headline PCE rose 0.5%, while core PCE increased 0.3%.
The consumer price index (CPI) rose to 3.7% in September from 3.4% in August. Core CPI, which excludes food and energy, rose to 2.6% from 2.4%. The 0.6% monthly increase in headline CPI was driven primarily by energy, with the energy index rising 5.2% in September. Gasoline prices rose 9.1% and accounted for more than half of the monthly increase. Shelter costs rose 0.4% in September and are up 3.2% over the last year. The Cleveland Fed’s trimmed-mean CPI increased 2.7% year-over-year in September. The Dallas Fed’s trimmed-mean PCE increased 2.3% year-over-year in September, up from 2.2% in August.

Headline PCE:
+0.5% month-over-month seasonally adjusted
+3.6% year-over-year
Core PCE: (excludes food and energy)
+0.3% month-over-month seasonally adjusted
+3.1% year-over-year
The Social Security Administration announced a 3.6% cost-of-living adjustment (COLA) for 2027, up from 2.8% in 2026, beginning with benefits payable in January. We recently reviewed the changes in our Annual Social Security Update.
Subscriber Note: Our “Economic Dashboard” tracks the key economic indicators we regularly monitor. You can access it anytime here: https://econ.brinkeradvisor.com/
FEDERAL RESERVE UPDATE
At the October 27-28 meeting, FOMC members voted 10-2 to hold the federal funds target range at 3.75% to 4.00%. The decision was a shift from September’s unanimous 12-0 vote to raise rates, as Governor Lisa Cook and Cleveland Fed President Beth Hammack dissented in favor of a quarter-point increase.
Below is the full monetary policy statement following the October FOMC meeting:
The Committee decided to maintain the target range for the federal funds rate at 3-3/4 to 4 percent, in support of the Federal Reserve's dual mandate. The Committee is continuing its policy of maintaining ample reserves in the banking system.
Economic activity is expanding at a strong pace. While uncertainty remains elevated owing, in part, to geopolitical developments, domestic spending has been resilient. Productivity growth is strong, and capital investment is robust. Job gains have kept pace with the workforce, and the unemployment rate has changed little.
Inflation remains elevated. The accumulation of more information will help the Committee determine the policy stance appropriate to ensure a timely return of inflation to the Committee's 2 percent goal. The Committee will deliver price stability.
Voting against the monetary policy action were Lisa D. Cook and Beth M. Hammack, who preferred to raise the target range for the federal funds rate by 1/4 percentage point at this meeting.
The decision to hold came after the minutes of the September 15-16 meeting showed that most participants judged another increase in the federal funds rate would likely be appropriate by year-end. Participants generally assessed inflation risk as skewed to the upside and viewed the labor market as near maximum employment. Several participants viewed the current policy rate as not restrictive or only mildly restrictive.
Following the October FOMC meeting, Fed Chair Warsh hosted a press conference. You can watch the press conference below or read the transcript PDF here.
At his post-meeting press conference, Chair Warsh noted that the Committee’s discussion “focused mainly on the price stability side of our remit,” a consistent theme of his tenure, as inflation has now remained above the Committee’s target for nearly six years. Chair Warsh described economic growth as strengthening, with high-tech investment driving an acceleration in business investment and capital expenditures, which are at a historically high share of GDP. Chair Warsh also announced that, beginning in 2027, one of the Committee’s eight annual meetings will focus exclusively on monetary policy strategy, with no vote on the federal funds rate.
During the question-and-answer session, Chair Warsh was asked why the Committee held rates steady amid elevated inflation and two members favoring an increase. He said the Committee chose to “take stock of where we are,” judging that the coming period is likely to provide more clarity. Chair Warsh also acknowledged that the Fed has not yet achieved price stability, saying, “you’re right about that, but we’re working on it.”
The gap between the Fed’s repeated commitment to price stability and its October decision risks eroding public confidence in its commitment to lowering inflation at a time when consumers’ long-run inflation expectations rose to 3.5% in the University of Michigan’s final October survey. With that in mind, historically the Fed has been reticent to make a monetary policy change at the meeting prior to a national election. We expect the Fed to increase rates at the December meeting.
The next FOMC meeting is scheduled for December 8-9 and will include an updated Summary of Economic Projections (SEP). At the end of October, CME FedWatch probabilities show a 70.7% chance of a quarter-point rate hike at the December meeting and a 29.3% chance of no change, with zero probability assigned to a rate cut.

SERIES I SAVINGS BOND UPDATE
Earlier this week, the Treasury Department announced the updated Series I Savings Bond rate. Series I Savings Bonds pay a composite rate that combines a fixed rate, which never changes, and an inflation rate that resets every six months. The new composite rate for I bonds issued from November 1, 2026 through April 30, 2027, is 5.51%, including a fixed rate of 1.40%. Series I bonds issued over the prior six-month period from May 1 through October 31 carried a composite rate of 4.26%, including a fixed rate of 0.90%.
Interest compounds semiannually, and the bonds earn interest for up to 30 years. Investors can buy up to $10,000 in electronic I bonds each calendar year through TreasuryDirect. Investors can redeem I bonds after twelve months, though bonds redeemed within five years forfeit the last three months of interest. Series I bond interest is exempt from state and local income taxes, and investors can defer federal tax until the bonds are redeemed or mature.
The new Series I bond fixed rate of 1.40% is the highest since November 2006, but it remains below the real yields on TIPS, which ended October at 2.25% on five-year TIPS and 2.60% on ten-year TIPS. Investors who can hold TIPS to maturity currently earn roughly 0.9 to 1.2 percentage points more per year above inflation. In exchange,
I bonds never decline in value, while TIPS prices can fall before maturity if real yields rise.
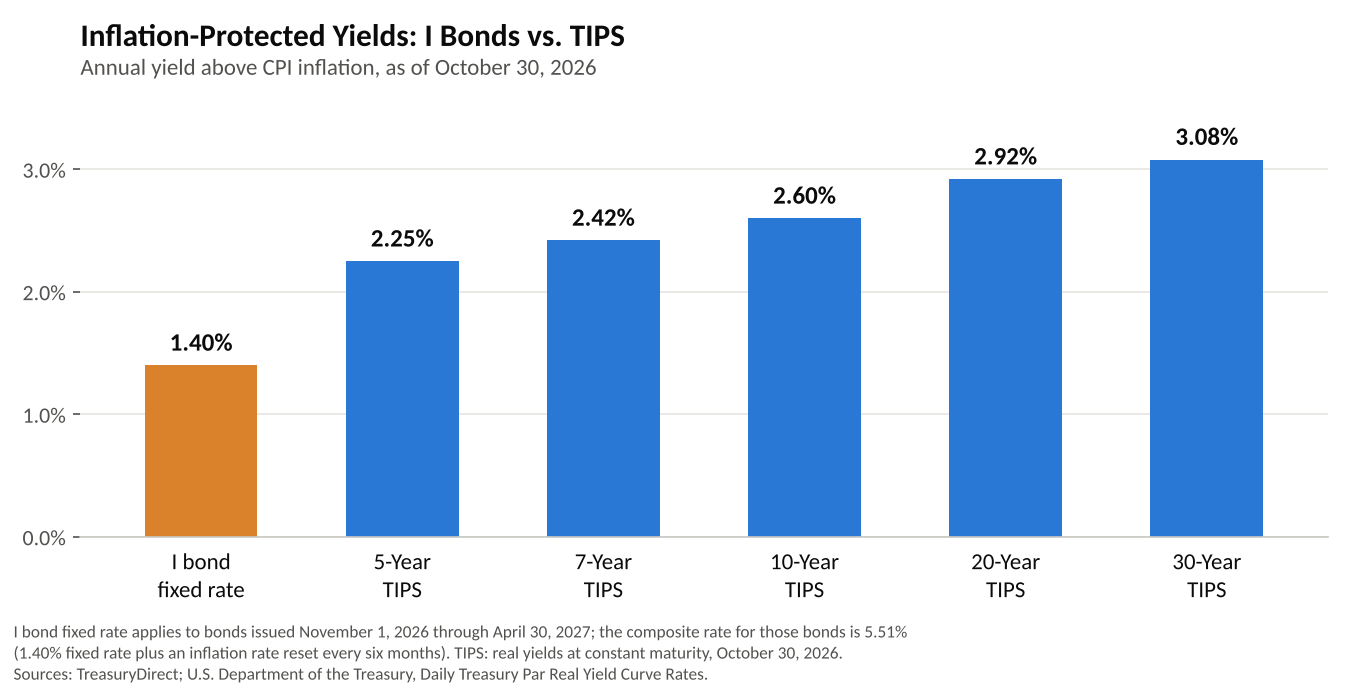
Series I bonds are best for investors who can hold for at least five years and stay under the purchase limit, while TIPS are best for larger balances and investors who may need to sell before maturity.
MONEY SUPPLY
MODEL PORTFOLIOS UPDATE
Below is the monthly update of the Marketimer and Brinker Fixed Income Advisor Model Portfolios through October 31, 2026.
